
Why do nursing students need to study Epidemiology and Biostatistics? Because nurses see patterns before anyone else. You are on the front lines. You are the ones recording the data in the registers, taking the vital signs, and noticing when something just does not feel right.
A doctor treats the patient in Bed 3. A nurse notices that Beds 3, 4, 5, and 7 all came from the same village with the same symptoms. That shift in thinking from individual to population is the true heart of epidemiology.
| Aspect | Clinical Care (The Individual) | Epidemiology (The Population) |
|---|---|---|
| Scenario | Treats one child with diarrhoea. | Notices 10 children from the same village with diarrhoea today. |
| Core Question | How do I treat this child right now? (Give ORS, Zinc, antibiotics) | Why are many children affected, and how do we stop it? |
| Primary Focus | Diagnosis and treatment of the individual patient. | Prevention and control across the entire community. |
- Seeing several children with watery diarrhoea from the same parish implies a possible contaminated water source.
- Noticing a massive spike in malaria cases two weeks after heavy rains start shows a seasonal pattern that is predictable and preventable.
- Observing that many pregnant mothers are missing their ANC visits this month raises the question of a system or transport barrier.
- Realizing that drug stock outs in the pharmacy are directly leading to delayed patient healing involves supply chain epidemiology.
- Spotting that post operative wound infections cluster around one particular surgeon or one particular shift reveals an infection control breakdown.
Observe ➔ Count ➔ Interpret ➔ Act
First, you observe a problem (many coughing patients). Next, you count them (collect data). Then, you interpret the data using biostatistics. Finally, you take action (health education, vaccination, water treatment).
Mnemonic: Only Clever Individuals Act (OCIA = Observe, Count, Interpret, Act).
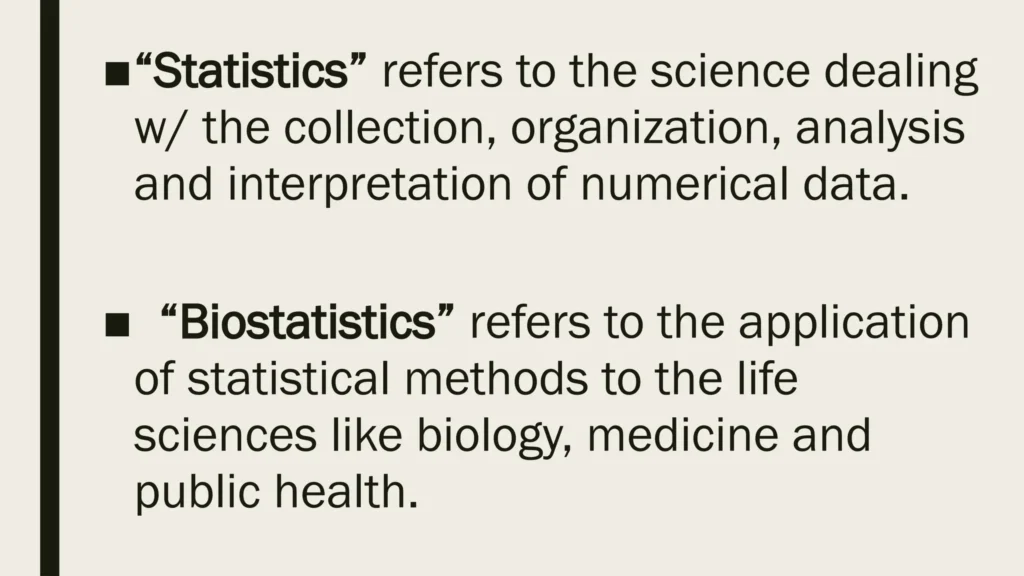
Definition: Epidemiology is the study of how often diseases occur in different groups of people and why. It is the science of public health and the foundation of evidence based nursing practice.
Epidemiology specifically looks at four main pillars:
- How often diseases occur (Frequency, Counting, Magnitude).
- Who is affected (Person features like age, sex, occupation, immune status, behaviour).
- Where and when they occur (Place and Time such as geography, season, year).
- Why they occur (Determinants, Causes, Risk factors, Protective factors).
The ultimate goal of epidemiology is NOT just to study diseases. It is to use these findings to prevent, control, and eliminate health problems. Epidemiology without action is just an academic exercise.
Definition: Biostatistics is the application of statistical and mathematical methods to health, biology, and medicine. It is the language of numbers that epidemiology speaks.
If epidemiology asks the question ("Why are people getting sick?"), biostatistics provides the numerical tools to prove the answer. It helps us to:
- Collect data properly: Ensuring we ask the right questions to the right people, using valid and reliable tools.
- Summarise findings: Turning 1,000 messy patient records into a clean, easy to read table, graph, or chart.
- Analyse patterns: Using math to see if a spike in disease is a real emergency or just random chance.
- Interpret results: Figuring out what the numbers actually mean for patient care and public health policy.
- Test hypotheses: Determining whether an exposure truly causes an outcome, or if the association is coincidental.
- Make predictions: Forecasting disease burden to help with resource planning and budgeting.
Epidemiology asks: What is happening, to whom, where, when, and why?
Biostatistics answers: How many, how large is the risk, how certain are we, and what does the math mean?
Together, they turn health observations into solid evidence. One without the other is incomplete.
Distribution means describing the pattern of the disease in a population. We map it out using three variables known as the Three Ws:
| Variable | What It Means | Examples |
|---|---|---|
| WHO (Person) | Who is getting sick? What are their characteristics? | Children under 5? Pregnant women? Elderly men? Farmers? HIV positive individuals? |
| WHERE (Place) | Where is the outbreak or disease concentrated? | One school? One village? Near a swamp? Nationwide? Urban versus rural? |
| WHEN (Time) | When did it start? Is there a temporal pattern? | Seasonal (malaria in rainy season)? Sudden spike (food poisoning hours after a wedding)? Cyclical (every 2 to 3 years)? |
Cases are highest among children under 5 (Who), living near a contaminated borehole (Where), immediately after heavy rains and flooding (When). This pattern tells the nurse exactly where to target water purification and health education.
Determinants are the underlying risk factors or causes that either increase or decrease the chance of a disease occurring. They explain the "why" behind the pattern.
Categories of Determinants:
- Biological determinants: Age, sex, genetic predisposition, immune status.
- Behavioural determinants: Sleeping without a mosquito net, smoking, poor hand hygiene, unsafe sexual practices.
- Environmental determinants: Drinking untreated river water, living near stagnant water, air pollution, overcrowding.
- Social determinants: Poverty, education level, occupation, access to healthcare, cultural beliefs.
- Healthcare system determinants: Drug stock outs, lack of vaccines, understaffing, poor infection control.
Important Distinction: A risk factor is any attribute or exposure that increases the probability of disease. A cause is a risk factor that, when removed, reduces the disease. Not all risk factors are direct causes, but all causes are risk factors.
Exam Alert: You MUST know these terms for your exam. Examiners love to give a scenario and ask you to identify the exposure, outcome, population, and sample.
An abnormal condition that negatively affects the structure or function of the body or mind. It represents a departure from normal health.
Examples: Malaria, Tuberculosis (TB), Hypertension, Diabetes Mellitus, Depression, Measles, HIV/AIDS, Pneumonia.
Something a person has, does, or experiences BEFORE an outcome happens. It is the suspected cause or risk factor. In epidemiology, exposure does NOT only mean chemicals; it includes behaviours, environments, and characteristics.
Examples of Exposures:
- Drinking untreated water from a borehole.
- Coming into close contact with a coughing TB patient (droplet exposure).
- NOT using a mosquito net while sleeping.
- Having unprotected sexual intercourse.
- A lack of handwashing supplies in a maternity ward.
- Working in a mining environment (occupational exposure).
- Being vaccinated (a protective exposure).
The health result or event that we measure AFTER the exposure. It is what we are trying to explain or predict.
Examples of Outcomes:
- Developing malaria.
- Testing positive for TB in the laboratory.
- Delivering a baby safely versus experiencing a stillbirth.
- Recovering fully after treatment.
- Developing a post operative wound infection.
- Death (the most severe outcome).
- Improved quality of life after a rehabilitation program.
Exam Tip: Exposure versus Outcome
Always ask: Which came first? The exposure ALWAYS precedes the outcome. If you cannot establish temporal sequence, you cannot establish causation. This is called the temporality criterion of causation.
The ENTIRE group of people that we are interested in studying or protecting. It is the complete set of individuals who share a common characteristic.
Examples:
- ALL first year nursing students in Uganda.
- ALL children under five in a specific district.
- ALL pregnant women attending ANC at a specific hospital.
- ALL healthcare workers in a referral hospital.
- ALL residents of Village X during the month of July 2026.
A smaller, manageable subset selected from the broader population for actual study. We use samples because it is too expensive, time consuming, and often impossible to interview every single person in a population.
Crucial Rule: A good sample MUST represent the whole population. This is called representativeness.
- Bad sample: If your population is all children, your sample should not just be rich children from the city, that introduces selection bias and your findings will be misleading.
- Good sample: Randomly selecting children from urban, peri urban, and rural areas to match the true population distribution.
Example:
- Population: All 1,200 mothers in a catchment area.
- Sample: The 80 mothers the nursing team actually interviewed to find out why vaccines are being missed.
- Sampling method: Systematic random sampling (every 15th mother on the register).
The mathematical chance (probability) that an outcome will occur in a specific group over a specific period of time. Risk MUST have a denominator. Without a denominator, you are just counting cases, you are not measuring risk.
Risk = (New Cases ÷ Total People at Risk) × 100
The result is expressed as a percentage or proportion.
Why the denominator matters:
- 50 cases in a village of 500 equals 10% risk.
- 50 cases in a city of 50,000 equals 0.1% risk.
- The same number of cases means very different things depending on the population size.
Your slides provided several cases. Let us break down the logic behind each one, as these are exact replicas of how exam questions are formatted. For each scenario, identify: Population, Exposure, Outcome, and the Epidemiological Action.
The Situation: On Monday, 18 patients arrive with fever. Most are from the same parish. The nurse asks: "Is this normal, or is an outbreak starting?"
What to do first: Turn a vague concern into concrete data. Open the OPD register and look at the past 4 weeks.
Data to collect:
- Age and sex of each patient.
- Village or parish of residence.
- Date of symptom onset (not just arrival date).
- Specific symptoms (fever pattern, headache, rash, joint pain, bleeding).
- Lab test results (malaria RDT, blood smear, dengue test).
- Recent travel history or shared activities.
Epidemiological Action:
- Compare today's number (18 cases) to the usual baseline (for example, normally 3 cases per day).
- Calculate if this is a statistically significant increase (more than 2 standard deviations above the mean).
- Map where patients live to look for clustering.
- Ask about shared exposures: same market? Same well? Same funeral? Same church?
- If confirmed as an outbreak: notify the District Health Office immediately.
The Situation: Ten pupils develop diarrhoea after drinking from a school water point. The tank was recently repaired by a local technician.
Suspected Exposure: Drinking water from the newly repaired tank. (The repair may have introduced contamination like rust, sediment, or cross contamination from sewage.)
Outcome: Developing acute watery diarrhoea (possibly cholera, typhoid, or E. coli infection).
Immediate Action (The Do Not Wait Rule):
- Check water treatment logs to see if chlorine was added after repair.
- Check handwashing stations to see if they are functional and stocked.
- Collect a water sample for laboratory testing (bacteriological analysis).
- Temporarily close the water source to prevent further cases while investigating.
- Provide alternative safe water (bottled water, water trucking).
- Begin active case finding: interview ALL pupils and staff, not just the sick ones.
- Calculate attack rate: (Number sick ÷ Total exposed) × 100.
Lesson: Good epidemiology directly links identifying an exposure to preventing further cases. Action and investigation happen simultaneously.
The Situation: Three mothers develop severe wound infections after delivery. The ward recently ran out of handwashing soap and sanitizers for two days.
Suspected Exposure: Poor hand hygiene by staff due to limited supplies. (Notice: the exposure comes before the outcome, this is the temporality criterion.)
Outcome: Post partum wound infection (surgical site infection).
Investigation Steps:
- Check delivery dates to see if they align with the soap shortage period.
- Identify who was on shift during each delivery.
- Review wound care procedures and aseptic technique compliance.
- Check if the same surgical instruments were used (sterilization breach).
- Collect wound swabs for culture and sensitivity testing.
- Calculate infection rate: (Infected deliveries ÷ Total deliveries) × 100 during the shortage period versus before.
Action: Immediately restore infection prevention materials! Do not wait for the full investigation. Patient safety comes first.
Exam Alert: Pay close attention to this concept. You cannot measure risk just by looking at the number of sick people. You MUST look at the total population size (the denominator).
The Scenario:
- Village A: Reports 30 cases of malaria.
- Village B: Reports 30 cases of malaria.
The Question: Which village has a worse malaria problem?
The Trap: A novice would say "They are the same, both have 30 cases." An epidemiologist asks, "Out of how many?"
The Math:
- Village A has a total population of 300 people. Risk = 30 ÷ 300 = 0.10 = 10%.
- Village B has a total population of 1,500 people. Risk = 30 ÷ 1,500 = 0.02 = 2%.
Conclusion: Village A has a 5 times higher risk. 1 in 10 people are sick in Village A, compared to only 1 in 50 in Village B. This proves why Biostatistics (using denominators) is essential for health decisions.
The Situation: A village leader runs to the clinic shouting, "There are many strange fevers, people are dying!"
The Epidemiological Approach: Do not panic. Turn rumours into verifiable questions. Rumours are signals, but signals must be verified.
Action:
- Ask for details: How many people exactly? What are the exact symptoms? Where exactly in the village? When did the first case start?
- Immediately go to your clinic registers. Look at the past 4 to 6 weeks of data.
- Compare current numbers with historical data (same month last year, last month, baseline average).
- Look for: Is there a doubling of cases? Is the case fatality rate unusually high?
- If the numbers show a true statistical increase, you have confirmed a public health signal and must alert the District Health Office within 24 hours.
- If not, document the rumour, reassure the community, and continue surveillance.
The Situation: Patients complain the clinic waiting time is "too long" and some leave without being seen (LWBS = Left Without Being Seen).
Data Collection: The nurse records the exact arrival time and consultation time for 50 consecutive patients over one week.
Biostatistics in Action:
- Calculate the mean (average) waiting time.
- Calculate the median waiting time (less affected by extreme values).
- Look for patterns: Is it worst at 9:00 AM? After lunch? On Mondays?
- Identify the "bottleneck": Where are patients getting stuck? Registration? Triage? Waiting for lab results? Pharmacy queue?
- Calculate the percentage of patients who LWBS.
Action:
- Adjust staff shifts so more nurses are at triage during peak morning hours.
- Open a second registration desk during high volume periods.
- Implement a fast track system for stable returning patients on chronic medication.
Lesson: Epidemiology is not just for diseases, it is also for health systems management and quality improvement.
The Situation: During a routine review, a nurse notices that measles vaccination coverage in Village X dropped from 85% to 52% over six months. Meanwhile, Village Y maintained 88% coverage.
- Population: All children aged 12 to 23 months in Village X.
- Exposure: Living in Village X (with possible sub exposures like lack of health worker outreach, transport barriers, caregiver misinformation).
- Outcome: Incomplete measles vaccination (not fully immunized).
Epidemiological Investigation:
- Map the unvaccinated children to see if they are clustered in one area of the village.
- Interview 20 caregivers of unvaccinated children to find out why the vaccine was missed.
- Check health worker deployment logs to see if the outreach clinic was cancelled.
- Compare with Village Y to learn what Village Y does differently.
Action: Organize a catch up vaccination campaign. Partner with community health workers and village leaders. Address the specific barrier (transport, timing, or misinformation).
Resources in healthcare (money, staff, drugs, vehicles, time) are always limited. Epidemiology helps us decide where to put our energy first fairly, transparently, and based on evidence.
Scenario: Choosing Priorities
Your district has three major problems: Malaria, Teenage Pregnancy, and Hypertension. You only have money to tackle ONE right now. How do you choose fairly using evidence?
| Criterion | What to Ask | Example Application |
|---|---|---|
| Burden and Trend | Which problem affects the most people? Is it increasing rapidly? | Malaria affects 40% of the district. Teenage pregnancy is rising 15% per year. |
| Severity | Which one is killing people or causing the most disability? | Malaria causes 120 deaths per year. Hypertension causes strokes but fewer immediate deaths. |
| Preventability and Cost | Which one can we fix easily and cheaply? | Buying mosquito nets is cheaper than lifetime hypertension drugs. Teen pregnancy needs education and contraceptives. |
| Equity | Who is suffering most? Are vulnerable groups disproportionately affected? | Malaria hits poorest children hardest. Teen pregnancy is highest in out of school girls. |
| Community Priority | What does the community say is hurting them most? | Community leaders rank malaria as their number 1 concern at the last village meeting. |
Decision Making: You must involve health workers, district leaders, and community representatives to choose an action that is both evidence based and practically feasible. This is called participatory priority setting.
When asked about prioritization in an exam, always mention at least three criteria: Burden, Severity, and Preventability. Adding Equity and Community Input shows deeper understanding.
To do good research or investigation, you must ask a precise question. A vague question leads to vague answers. A standard epidemiological question must contain 4 elements: Population, Exposure, Outcome, and Place/Time.
Bad Question: "Does bad water cause sickness?"
Why it is bad: "Bad water" is vague. "Sickness" is vague. No population defined. No time frame. No place. Cannot be studied or answered.
Excellent Question:
"Among pupils at School X (Population), is drinking untreated borehole water (Exposure) associated with an increase in diarrhoea (Outcome) during July 2026 (Time and Place)?"
Why it is excellent: Every element is specific, measurable, and testable.
Question: Are nursing students who do not sleep under nets more likely to get malaria in the hostel?
- Population: Nursing students living in the hostel.
- Exposure: Not using a mosquito net while sleeping.
- Outcome: Laboratory confirmed malaria episode.
- Comparison: Net users versus Non users (this makes it a comparative study).
- Time: Over one academic semester (for example, March to July 2026).
Question: Is distance from home to the health facility associated with low antenatal care attendance among pregnant women in District Y?
- Population: All pregnant women in District Y.
- Exposure: Living more than 5 km from the nearest health facility.
- Outcome: Attending fewer than 4 ANC visits (WHO recommends 8 or more).
- Comparison: Women living 5 km or less versus more than 5 km from a facility.
- Time: Pregnancies registered between January and December 2026.
Population, Exposure, Outcome, Place, Time
Please Explain Our Problem Today
How will you use this in your daily career? It is split into two main areas:
- Tracking daily admissions and the most common diagnoses (surveillance).
- Monitoring Infection Prevention and Control (IPC) indicators: hand hygiene compliance rates, post operative wound infection rates, catheter associated infections.
- Tracking patient mortality (death rates) and recovery rates by diagnosis.
- Monitoring adverse drug reactions (ADR surveillance).
- Calculating average length of stay to free up beds and improve bed turnover.
- Monitoring nurse to patient ratios and their impact on outcomes.
- Evaluating the effectiveness of new nursing protocols or interventions.
- Identifying the most pressing priority health problems in a village or sub county.
- Mapping disease patterns (literally putting pins on a map to see where cholera is clustered, this is called spot mapping or GIS mapping).
- Planning targeted outreach services (like realizing Village B has low immunization coverage, so sending a mobile clinic there).
- Evaluating if a health program actually worked (comparing malaria rates before and after a mass net distribution campaign).
- Conducting community needs assessments to guide health education topics.
- Training community health workers (VHTs) to collect and report data.
When asked about the scope of epidemiology in nursing, give at least two hospital examples and two community examples. This shows you understand both clinical and public health nursing.
As a nursing student, you should be able to recognize the main study designs. You do not need to design them yet, but you must understand what each one does:
| Study Type | What It Does | Nursing Example |
|---|---|---|
| Cross sectional | Measures exposure and outcome at the same time. Like a snapshot. | A survey of 200 mothers to find out how many use mosquito nets right now. |
| Cohort | Follows exposed and unexposed groups forward in time to see who develops the outcome. | Follow 100 net users and 100 non users for 6 months to compare malaria rates. |
| Case Control | Starts with outcome (cases versus controls) and looks backward for past exposure. | Compare 50 children with diarrhoea (cases) versus 50 without (controls) for water source exposure. |
| Randomized Controlled Trial (RCT) | Participants randomly assigned to intervention or control. The gold standard for proving causation. | Randomly assign wards to use a new handwashing protocol versus standard protocol. Compare infection rates. |
| Ecological | Uses population level data, not individual data. Looks at trends across groups. | Comparing national immunization coverage rates with national child mortality rates across 10 countries. |
- Cross sectional = Current snapshot
- Cohort = Coming forward (follows forward)
- Case Control = Checking back (looks backward)
- RCT = Randomly assigns (the gold standard)
Cover the answers and test yourself. If you can answer these clearly, you are ready for Day 1's material!
- Define Epidemiology: The study of the distribution (who/where/when) and determinants (why/exposures) of health related states in specific populations, and applying this study to control health problems. Mnemonic: Epi = Upon the people (Greek: epi = upon, demos = people, logos = study).
- Define Biostatistics: The application of statistical methods to collect, summarize, analyze, and interpret health and biological data. Think: Bio (life/health) + Statistics (numbers) = Health Numbers.
- Give an example of an exposure: Drinking contaminated water; smoking cigarettes; poor handwashing; not using a mosquito net; occupational dust exposure. Remember: Exposure comes BEFORE the outcome.
- Give an example of an outcome: Developing typhoid; getting lung cancer; post operative wound infection; death; recovery after treatment. Remember: Outcome is what we measure AFTER the exposure.
- Explain risk using numbers: Risk requires a denominator. If 15 students out of a total population of 120 students get a fever, the risk is (15 ÷ 120) = 0.125, or 12.5%. Without the denominator (120), "15 cases" means nothing. Always ask: "Out of how many?"
- Why is a sample used? Because it is impossible, expensive, and time consuming to study an entire population. A sample is a smaller group that must accurately represent the whole population (representativeness). Bad sample = biased results = wrong conclusions = harmful decisions.
- What are the 4 steps of public health action? Observe ➔ Count ➔ Interpret ➔ Act (OCIA). Mnemonic: Only Clever Individuals Act.
- What are the 3 Ws of distribution? Who (Person), Where (Place), When (Time). These describe the pattern of disease in a population.
- What makes a good epidemiological question? It must specify Population, Exposure, Outcome, Place, and Time (PEOPT). Mnemonic: Please Explain Our Problem Today.
- Why is temporality important in establishing causation? The exposure must occur BEFORE the outcome. If the outcome happens before the exposure, it cannot be a cause. This is the first and most essential criterion of causation.
- Gordis, L. (2014). Epidemiology. Elsevier Health Sciences.
- World Health Organization (WHO). (2006). Basic Epidemiology. World Health Organization.
- Centers for Disease Control and Prevention (CDC). (2012). Principles of Epidemiology in Public Health Practice.
- Rosner, B. (2015). Fundamentals of Biostatistics. Cengage Learning.
Quick Quiz
Epidemiology Introduction Quiz
Epidemiology and Biostatistics - mobile-friendly and focused practice.
Privacy: Your details are used only for quiz tracking and certificates.
Epidemiology Introduction Quiz
Epidemiology and Biostatistics
Preparing questions...
Choose your answer and keep your streak alive.
Great effort.
Here is your quick performance summary.