
By the end of this session, you should be able to:
- Identify common sources of health data used in epidemiology and health services.
- Explain why data quality matters for patient care, surveillance, and research.
- Compare questionnaires, interviews, observation, and records review, knowing when to use each.
- Apply practical quality-control checks during data collection.
- Draft a simple data collection tool for a community health problem.
Health workers make decisions using data from registers, reports, surveys, and clients. Poor data can lead to wrong priorities, missed outbreaks, and weak patient follow-up. Good data collection starts before the form is printed or uploaded. The best method depends on the question, the population, and the resources available.
Every data collection effort follows a practical chain. Skip a step, and your data may be useless or worse, misleading.
- Health Question: Clarify what you need to know
- Data Source: Choose where information comes from
- Method: Choose how to collect it
- Quality Checks: Protect accuracy and completeness
- Decision: Use findings to improve practice
"Question → Source → Method → Quality → Decision" = QSMQD. Think: "Quality Starts Making Quick Decisions."
Health data are recorded facts about people, services, diseases, risks, and outcomes. Data may describe a person, a health facility, a community, or a whole district. Data become useful only when they are organized, analysed, and interpreted for decision-making.
🏥 Example: The number "47 malaria cases" is just a number. But "47 malaria cases in Village A this week, compared to an average of 8 cases per week over the past 6 months" is information that triggers action. Context transforms data into evidence.
Use more than one source when triangulation is needed, comparing data from multiple sources to confirm findings and reduce bias.
| Source | What It Is | Examples |
|---|---|---|
| Routine Records | Data produced during normal service delivery. Collected continuously as part of patient care. | OPD registers, patient files, ANC cards, immunisation registers, pharmacy stock cards, HMIS reports. |
| Surveys | Data collected from a sample of people or households using structured questionnaires or interviews. | Household survey on mosquito net use, client exit interview on satisfaction, school survey on handwashing. |
| Surveillance | Regular, systematic reporting designed to detect disease patterns, trends, and outbreaks early. | Weekly IDSR reports, maternal death notifications, laboratory reporting of confirmed cases, notifiable disease registers. |
| Research Studies | Data collected under a planned scientific protocol to answer a specific research question. | Cohort study of newborn survival, case-control study of cholera risk factors, RCT comparing two interventions. |
Routine records are the backbone of health information systems. They are produced during normal service delivery and are available continuously.
- OPD register: Records diagnosis, age, sex, village, date of visit, and treatment given for every outpatient.
- ANC register: Records visit number, gestational age, HIV testing result, haemoglobin, blood pressure, and tetanus vaccination for every pregnant woman.
- Immunisation register: Records vaccine doses given, dates, and defaulters (children who missed scheduled doses).
- Delivery register: Records mode of delivery, birth weight, APGAR score, maternal complications, and neonatal outcomes.
- Pharmacy stock card: Tracks medicine stock levels, consumption, and stock-outs.
- Available continuously, no special funding or planning needed.
- Often cheap to use, the data is already being collected.
- Cover large populations over long periods, good for trends.
- Reflect real-world clinical practice, not artificial research settings.
- May have missing entries, staff are busy, and some fields get skipped.
- Diagnostic errors, a nurse may record "malaria" without a test, or confuse similar conditions.
- Reflect only people who reached care, they miss people who never came to the facility (selection bias).
- Variable quality across facilities, some health centres keep excellent records; others are chaotic.
- Definitions may change over time, making trend analysis difficult.
📝 Exam Tip: When asked about routine records, always mention both strengths and limitations. Examiners want to see that you understand routine data is valuable but not perfect. Never say "routine data is always accurate" or "routine data is useless."
Surveys collect data from a sample of people or households when routine records are insufficient or when you need population-level estimates.
- The information is not found in routine records (e.g., mosquito net use at home, dietary practices, knowledge of danger signs).
- The researcher needs population-level estimates (e.g., what percentage of ALL children in the district are vaccinated? Routine records only show those who came to clinic).
- Views, practices, or behaviours must be measured (e.g., why do mothers miss ANC visits? What do community members think about family planning?).
- Household survey: Interviewing 200 randomly selected households about mosquito net ownership, use, and condition.
- Client exit interview: Asking 50 patients leaving the clinic about their satisfaction, waiting time, and understanding of their diagnosis.
- School survey: Observing and interviewing 300 students about handwashing practices and toilet use.
Surveillance is action-oriented. It is not just about counting cases, it is about detecting changes and triggering response.
- It asks: "What is changing? Where? Who is affected?"
- It should trigger investigation or response when thresholds are crossed.
- It is usually mandatory, health facilities must report certain diseases by law.
- It operates on regular cycles, weekly, monthly, or immediate (for epidemic-prone diseases).
- Weekly IDSR (Integrated Disease Surveillance and Response) reports: Facilities report counts of priority diseases (malaria, diarrhoea, measles, meningitis, etc.) every Monday.
- Maternal death notification: Every maternal death must be reported within 24 hours and investigated within a week.
- Laboratory reporting: Confirmed cases of TB, HIV, and cholera are reported from the lab to the district and national level.
⚡ Key Principle: Surveillance is not research. Research asks "Why?" and seeks to generate new knowledge. Surveillance asks "What is happening now?" and seeks to trigger action. A nurse doing surveillance reports data quickly; a nurse doing research analyses data deeply. Both are essential.
Research studies are planned investigations designed to answer specific questions with rigorous methods.
- Clear study question and defined population.
- Standardized procedures, every participant is treated the same way.
- Ethical approval, research involving humans must be approved by an ethics committee.
- Higher control over quality, trained data collectors, validated tools, supervision.
- More costly, requires funding, time, and expertise.
- Cohort study: Following 500 newborns for 12 months to measure survival rates and identify risk factors for mortality.
- Case-control study: Comparing 100 cholera cases with 100 healthy controls to identify shared exposures (water source, food, travel).
- Randomized Controlled Trial (RCT): Randomly assigning 200 wards to use a new handwashing protocol vs. standard protocol, then comparing infection rates.
Health data are not only clinical data. Administrators, communities, and digital systems also produce valuable information.
| Source Type | Examples |
|---|---|
| Administrative Data | Staffing levels, budgets, medicine stock cards, supply records, transport logs, building maintenance records. |
| Community Data | VHT (Village Health Team) reports, community mapping of water sources and latrines, local leader records of births and deaths, traditional birth attendant logs. |
| Digital Systems | Electronic Medical Records (EMR), DHIS2 (District Health Information Software), ODK/Kobo Collect mobile forms, SMS reporting systems, telemedicine platforms. |
The most common mistake in data collection is choosing the tool before clarifying the question. Always start with: "What do I need to know?" Then ask: "Where can I find this information?"
| Question | Best Source |
|---|---|
| How many malaria cases were treated last month? | OPD register / HMIS report (routine data) |
| Why are mothers missing ANC visits? | Survey + interviews (not found in routine records) |
| Is measles increasing this week? | Surveillance data (weekly IDSR reports) |
| Did a new intervention reduce infection rates? | Research study data (before-and-after comparison or RCT) |
| How many nurses are on duty per shift? | Administrative data (staffing rosters) |
| What percentage of households have a functional latrine? | Community data (VHT household survey) or household survey |
🩺 Problem: A health centre wants to know why many children miss measles vaccination.
- Routine source: Immunisation register identifies who missed the dose and where they live. This gives the "what" and "where."
- Survey source: Caregiver questionnaire explains why, access barriers (distance, cost), knowledge gaps ("I didn't know it was due"), fear ("I heard the vaccine causes fever"), or practical barriers ("I had no transport money").
- Interview source: Health worker interviews explain system barriers, stock-outs ("We ran out of measles vaccine"), staffing ("The outreach nurse was on maternity leave"), or scheduling ("The clinic is only open when I am at work").
Conclusion: The best approach combines records review, caregiver survey, and staff interviews. No single source tells the whole story. Routine data shows the problem; surveys and interviews explain it.
Good data are not just "correct" data. They are fit for the decision being made. Data quality has multiple dimensions, and all of them matter.
- Fit for purpose: The data answers the question you are asking. Data on patient satisfaction does not help you plan drug stock.
- Accurate enough: The data correctly represents what happened. A blood pressure of 180/110 recorded as 120/80 is inaccurate and dangerous.
- Complete enough: Missing data can hide who is most affected. If 30% of age fields are blank, you cannot identify vulnerable age groups.
- Available in time: Data submitted three weeks late cannot support outbreak response. Timeliness is a quality dimension.
- Understandable: The people who need the data can read, interpret, and act on it. A complex statistical report given to a village health team is useless.
Think of these as the five pillars of trustworthy data. Weakness in any pillar weakens the whole structure.
| Dimension | Definition | Nursing Example |
|---|---|---|
| Accuracy | Data correctly represent what happened. The recorded value matches reality. | A child's weight is 12.5 kg, and the register records 12.5 kg. A diagnosis of "malaria" is confirmed by RDT, not guessed. |
| Completeness | All required information is present. No critical fields are missing. | If 100 outpatient visits are recorded but age is missing for 30, completeness is 70%. Incomplete age data hides which age groups are most affected. |
| Timeliness | Data are submitted or available when needed for decision-making. | Weekly outbreak reports submitted on Monday morning, not three weeks later. Maternal death notifications within 24 hours. |
| Consistency | Data agree across different forms, registers, and reports. No contradictions. | Immunisation tally sheets report 82 doses, and the monthly summary also reports 82 doses, not 128. The ANC register and the delivery register agree on the number of deliveries. |
| Validity | Values are within acceptable rules and make sense. No impossible or illogical entries. | Sex is not recorded as "7." Age is not negative. A 2-year-old does not have 10 pregnancies. Haemoglobin is not 500 g/dL. |
"All Cats Take Care Very Seriously" = ACTCVS → Accuracy, Completeness, Timeliness, Consistency, Validity. (Add "S" for "Sensitivity" if needed, but the five above are the core.)
Completeness asks: "Are all required fields filled?"
- Example: If 100 outpatient visits are recorded but age is missing for 30 patients, age completeness is 70%.
- Why it matters: Incomplete data can hide who is most affected. If age is missing for 30% of malaria cases, you cannot tell whether children or adults are most at risk. Your prevention strategy will be blind.
- Field practice: Review forms before leaving the facility or household. Check every required field. If a field is missing, ask the respondent or check the record immediately, do not wait.
Accuracy asks: "Is the recorded value correct?"
- Example: Recording a 3-month-old child as "30 years old" is inaccurate. Recording a weight of 65 kg as "56 kg" is inaccurate.
- Why it matters: Inaccurate data leads to wrong clinical decisions (wrong drug dose) and wrong public health decisions (targeting the wrong age group).
- How to improve: Clear definitions, training, supervision, and verification. For critical indicators, verify a sample of forms against source documents (e.g., compare the register with the patient's actual file).
Timeliness asks: "Did data reach decision-makers on time?"
- Example: Weekly outbreak reports submitted three weeks late cannot support rapid response. By the time the data arrives, the outbreak may be over or may have spread.
- Why it matters: Timely data are essential for epidemics, stock-outs, referrals, and maternal deaths. A delayed maternal death report means missed opportunities to prevent the next death.
- Field practice: Set daily upload deadlines and monitor submissions. Use digital tools with automatic timestamps. Hold supervisors accountable for late reports.
Consistency asks: "Do related records agree?"
- Example: Immunisation tally sheets report 82 doses, but the monthly summary reports 128 doses. Where did the extra 46 doses come from? Double counting? Transcription error? Fraud?
- Why it matters: Inconsistency undermines trust in the data. If the district cannot trust facility reports, they cannot plan accurately.
- Field practice: Reconcile totals before submission. Cross-check the register against the tally sheet against the summary report. If they do not match, find out why before sending the report.
Validity asks: "Are values within acceptable rules?"
- Example: Sex should not be recorded as "7", the only valid values are "M" and "F" (or 1 and 2). Age should not be negative. A haemoglobin of 500 g/dL is physiologically impossible.
- Why it matters: Invalid entries corrupt the dataset. If "7" is entered for sex 50 times, your analysis of male vs. female patients will be wrong.
- Field practice: For digital forms, use constraints to prevent invalid entries at the point of collection (e.g., age must be between 0 and 120). For paper forms, train data collectors on valid ranges and check forms daily.
Problems usually begin during collection, but they can also arise from systems and processes.
| Problem Type | Examples | Prevention Strategy |
|---|---|---|
| Collection Errors | Skipped questions. Poor probing or leading questions. Wrong units (weeks instead of months). Unclear handwriting in paper forms. Socially desirable answers. | Training, supervision, pretesting, clear instructions, neutral wording, daily form review. |
| System Errors | Duplicated records. Late uploads or missing forms. Mismatch between registers and summaries. Wrong facility or village code. Software bugs. | Unique identifiers, automated deduplication, real-time monitoring, code validation, regular system audits. |
Good data support better choices at every level of the health system:
| Level | How Data Is Used | Nursing Example |
|---|---|---|
| Patient Care | Follow-up, referrals, diagnosis history, treatment continuity. | A nurse checks the ANC card and sees the patient missed her last two visits. She calls the patient to reschedule and assess for complications. |
| Public Health | Detect outbreaks, monitor disease burden, target prevention. | Weekly surveillance data shows a doubling of diarrhoea cases. The district triggers a cholera investigation and distributes water purification tablets. |
| Management | Plan staff, medicines, outreach, equipment, and budgets. | OPD data shows malaria peaks in April. The manager orders extra ACTs and RDTs in March, before the season starts. |
| Research | Generate evidence, evaluate interventions, publish findings. | A study finds that community health worker home visits reduced childhood mortality by 25%. This evidence is used to scale up the program nationally. |
🩺 Scenario: A supervisor reviews 10 completed household questionnaires.
| Check | Finding | Calculation | Result |
|---|---|---|---|
| Completeness | 8 of 10 forms have all required fields filled. | 8 ÷ 10 × 100 | 80% |
| Timeliness | 7 of 10 forms uploaded same day. | 7 ÷ 10 × 100 | 70% |
| Validity | 2 forms have age outside expected range (e.g., 150 years or -3 years). | 8 valid ÷ 10 × 100 | 80% |
Interpretation: The team should improve same-day uploads (timeliness = 70%) and check age-entry rules before full data collection (validity = 80%). Completeness is acceptable but could be improved. These indicators guide targeted quality improvement.
Choosing a data collection method is a design decision. The wrong method produces the wrong data. The right method produces trustworthy evidence.
- What exactly must be measured? (Knowledge? Behaviour? Clinical outcome?)
- Who or what has the information? (Patients? Caregivers? Health workers? Records?)
- Is the topic private or difficult? (Sexual behaviour? Domestic violence? Substance use?)
- What time, skills, and tools are available? (Trained interviewers? Digital devices? Transport?)
- What checks will protect the data? (Supervision? Validation? Duplicate checks?)
Definition: Structured questions asked in the same way to many people. Usually self-administered or administered by a trained interviewer reading from a script.
- Good for surveys and quantitative analysis, every respondent answers the same questions, making comparison easy.
- Easy to standardize across multiple data collectors, reduces interviewer bias.
- Works well for knowledge, practice, and service-use questions (e.g., "Do you sleep under a mosquito net?" "How many ANC visits did you attend?").
- Can be administered to large numbers relatively quickly.
- Digital questionnaires (ODK, Kobo) allow automatic skip patterns and validation.
- May miss detailed explanations, a questionnaire cannot probe "Why did you miss ANC?" as deeply as an interview.
- Poor wording creates biased answers. A leading question like "You always attend ANC, don't you?" produces socially desirable answers.
- Respondents may forget ("When was your last ANC visit?" "Um... maybe March?") or give socially desirable answers ("Yes, I wash my hands" when the interviewer can see dirty hands).
- Requires literacy if self-administered; requires trained interviewers if administered.
Definition: Guided conversations to explore experiences, explanations, and perceptions. Can be structured (fixed questions), semi-structured (flexible questions with probes), or unstructured (open conversation).
- Useful for understanding reasons and perceptions, "Why did you not seek care immediately?" "What did you think when the nurse told you your child had malaria?"
- Allows probing and clarification, the interviewer can ask follow-up questions based on the respondent's answers.
- Good for health workers, leaders, and clients, anyone with complex experiences to share.
- Can build rapport and trust, especially for sensitive topics.
- Requires skilled interviewers, untrained interviewers may lead respondents, misrecord answers, or fail to probe deeply.
- Takes time to transcribe and analyse, qualitative data is rich but labour-intensive.
- Responses may be influenced by interviewer style, a friendly interviewer may get different answers than a stern one (interviewer bias).
- Not feasible for large sample sizes due to time and cost.
📝 Exam Tip Questionnaire vs. Interview: Use a questionnaire when you need standardized, comparable data from many people (surveys, knowledge assessments). Use an interview when you need depth, explanation, and understanding from fewer people (exploratory research, understanding barriers, capturing stories). Many studies use both, questionnaires for breadth, interviews for depth.
Definition: Recording what is seen using a checklist or structured form. The observer watches and records behaviours, conditions, or practices without interfering.
- Good for facility readiness and practice assessment, "Is handwashing soap available at every sink?" "Does the nurse use a sterile needle for every injection?"
- Can verify whether resources are present, you see the stock-out with your own eyes, rather than relying on a report.
- Reduces reliance on self-report, people may say they wash their hands, but observation shows whether they actually do.
- Can capture non-verbal behaviours and environmental conditions.
- People may change behaviour when observed (Hawthorne effect). A nurse who never washes hands may start washing when she sees the observer.
- Only captures what happens during observation, you miss what happens at night, on weekends, or when you are not there.
- Requires clear observation criteria, what counts as "good handwashing"? 20 seconds? Soap? Running water? Without clear criteria, observers disagree.
- Can be intrusive and may affect the normal workflow of the facility.
Definition: Extracting data from existing documents or systems, registers, patient files, laboratory logs, pharmacy stock cards, HMIS reports.
- Useful for trends and service volumes, "How many malaria cases were treated each month for the past year?"
- Usually cheaper than collecting new data, the data already exists; you just extract it.
- Can cover long periods, years of data can be reviewed in days.
- No respondent burden, you do not need to ask anyone questions.
- Dependent on record quality, if the original records are incomplete, inaccurate, or illegible, your extracted data will be too.
- Missing values may be difficult to correct, you cannot go back and ask the patient from 2019 why a field was blank.
- Definitions may vary over time or across facilities, "malaria" may mean "clinical diagnosis" in one facility and "RDT-confirmed" in another. Comparing them is misleading.
- May require ethical approval if patient identifiers are used.
| Method | Best For | Strengths | Limitations |
|---|---|---|---|
| Questionnaire | Large surveys, standardized knowledge/practice data | Standardized, scalable, easy to analyse | Misses depth, poor wording biases answers, recall errors |
| Interview | Understanding reasons, perceptions, complex experiences | Deep, flexible, builds rapport | Time-consuming, requires skill, interviewer bias |
| Observation | Verifying practices, facility readiness, behaviour | Objective, reduces self-report bias | Hawthorne effect, limited to observation period, needs clear criteria |
| Records Review | Trends, service volumes, historical data | Cheap, covers long periods, no respondent burden | Dependent on original quality, missing data hard to fix, definitions may vary |
Digital tools such as ODK (Open Data Kit), KoboToolbox, and REDCap have transformed data collection in low-resource settings.
- Constraints prevent impossible values, e.g., age cannot be negative, haemoglobin cannot exceed 20 g/dL.
- Skip patterns reduce irrelevant questions, if a woman says she is not pregnant, the tool automatically skips all pregnancy-related questions.
- Daily uploads allow supervisors to identify problems early, instead of discovering errors at the end of fieldwork, supervisors can correct them daily.
- GPS tagging ensures data collectors actually visited the claimed location.
- Automatic timestamps verify when data was collected.
- No transcription errors, data is entered directly into digital format, eliminating the step of transferring paper to computer.
- Digital systems still require training, supervision, and data protection. A tablet with unencrypted patient data is a liability.
- Technology can fail. Batteries die, networks fail, devices break. Always have a paper backup plan.
- Not everyone is comfortable with technology. Older data collectors or those with limited literacy may struggle with digital forms.
- Data security is critical. Patient identifiers must be encrypted, and access must be restricted to authorized personnel.
Ethics is not an afterthought, it is built into every step of data collection.
- Explain the purpose of data collection in simple language the respondent can understand. Do not use medical jargon.
- Seek voluntary informed consent before asking questions. The respondent must understand what they are agreeing to, know they can refuse, and know they can withdraw at any time.
- Protect privacy, especially for sensitive health information (HIV status, mental health, sexual behaviour, substance use). Conduct interviews in private settings.
- Avoid collecting names unless they are absolutely necessary for follow-up. Use study IDs instead.
- Store completed forms and devices securely. Paper forms should be locked in a cabinet. Digital data should be encrypted and password-protected.
- Do not share individual data with unauthorized people. Aggregate summaries (e.g., "30% of patients were hypertensive") are fine; individual patient records are not.
🚨 Ethical Red Line: Never collect data without informed consent. Never share identifiable patient information. Never pressure a respondent to answer questions they are uncomfortable with. Ethical violations destroy trust, harm patients, and can lead to legal consequences.
🩺 Objective: Assess barriers to completing four ANC visits among pregnant women.
| Indicator | Question | Response Option |
|---|---|---|
| ANC attendance | How many ANC visits have you attended during this pregnancy? | Number of visits (0, 1, 2, 3, 4, 5+) |
| Distance barrier | How long does it take you to reach the nearest health facility? | Minutes / hours (continuous) |
| Cost barrier | Did transport cost stop you from attending ANC? | Yes / No (nominal) |
| Knowledge | When should a pregnant woman start ANC? | First trimester / later / do not know (ordinal, ordered by correctness) |
Key principle: Each question maps directly to an indicator. The response options match the data type needed for analysis. This is how good tools are built, indicator by indicator, question by question.
| Weak Question | Problem | Improved Question |
|---|---|---|
| "You always attend ANC, don't you?" | Leading question. Suggests the "correct" answer. Produces socially desirable responses. | "How many ANC visits have you attended during this pregnancy?" Neutral wording. Produces a measurable response. |
| "Do you have good health?" | Vague. "Good health" means different things to different people. Unmeasurable. | "In the past 30 days, how many days were you unable to do your normal activities because of illness?" Specific, time-bound, measurable. |
| "Why didn't you come to the clinic?" | Open-ended without structure. Hard to analyse. May embarrass the respondent. | "What was the main reason you did not attend the clinic? (Select one...)" |
Quality control is continuous, not a final activity. It begins the moment you design your tool and continues until the data are analysed and reported. Think of it as infection prevention for data, every step needs a barrier against error.
| Phase | What to Do | Practical Examples |
|---|---|---|
| Before | Design, review, translate, and pretest the tool. | Define every variable. Use simple words. Translate carefully. Pretest with 5-10 people similar to your target population. |
| During | Observe, review, debrief, and correct in real time. | Supervisors observe interviews. Review forms before leaving the field. Check GPS, dates, and required fields daily. Hold short debriefs. |
| After | Clean, validate, document, and protect the dataset. | Check for duplicates, missing values, impossible values. Compare related variables for logic errors. Keep raw data separate. Store securely. |
📝 Exam Tip The 5 Steps of Quality Control: "Design, Train, Observe, Clean, Improve" = DTOCI. Think: "Data Team Observes, Cleans, Improves." Another mnemonic: "Prepare, Collect, Check, Clean, Protect" = PCCCP.
The quality of your data is determined before you collect a single form. A poorly designed tool will produce poor data no matter how carefully your team works.
- Define every variable clearly before designing the form. What exactly do you mean by "fever"? By "delay"? By "treatment"? Write operational definitions.
- Use simple words and local examples that respondents understand. Avoid medical jargon. Instead of "Did you experience dyspnoea?" ask "Did you feel short of breath?"
- Translate carefully and back-check meaning. If your tool is in English but your respondents speak Luganda, translate professionally and then back-translate to English to check accuracy.
- Pretest the tool with a small group (5-10 people) similar to your target population. Watch for confusion, hesitation, or multiple interpretations of the same question.
- Revise confusing questions before full data collection. If 3 out of 10 pretest respondents misunderstand a question, rewrite it.
⚠️ Common Mistake: Skipping the pretest to "save time." This always costs more time later because you will have to re-collect data or throw out invalid responses. Pretesting is not optional, it is insurance.
Errors made during collection are the hardest to fix later. Supervision must be continuous and immediate.
- Supervisors should observe selected interviews respectfully. Do not interrupt, but watch for leading questions, skipped questions, or rushed responses. Give feedback privately after the interview.
- Review completed forms before leaving the village or facility. Do not let a data collector leave with a form full of blanks or obvious errors. Fix it while the respondent is still available.
- Check GPS coordinates, dates, facility codes, and required fields daily. A form with no date or wrong facility code is useless for analysis.
- Hold short debriefs at the end of each day. Discuss errors, difficult questions, and respondent reactions. Share solutions across the team.
- Correct procedures immediately, not at the end of fieldwork. If one data collector is consistently making the same mistake, retrain them today, not next week.
Data cleaning is not just "fixing typos." It is a systematic process of checking, correcting, and documenting every decision.
- Check for duplicates: Did the same person get interviewed twice? Same ID number? Same name? Remove or merge duplicates.
- Check for missing values: Which questions were skipped? Was it random (data collector error) or systematic (respondents refused a sensitive question)?
- Check for impossible values: Age = -5? ANC visits = 50? Sex = "Male" but pregnancy question answered? These are red flags.
- Compare related variables for logic errors: A child with "no fever" should not have a "date of fever onset." A 12-year-old should not be married. Inconsistencies reveal data quality problems.
- Document all cleaning decisions in a simple log. What did you find? What did you change? Why? Who decided? This log is your audit trail.
- Keep raw data separate from cleaned data. Never overwrite the original file. Save the raw dataset as "Raw_Data_v1" and the cleaned dataset as "Clean_Data_v1."
- Store files securely and restrict access to authorized people. Health data are confidential. Use password protection, encrypted drives, and locked cabinets for paper forms.
📝 Exam Tip: When asked about data cleaning, always mention at least: duplicates, missing values, impossible values, logic checks, documentation log, and data security. This shows comprehensive understanding.
Dataset:
| Record | Age | Sex | ANC Visits | Problem | QC Action |
|---|---|---|---|---|---|
| 001 | 24 | Female | 3 | No obvious error | Accept as valid. |
| 002 | -5 | Female | 2 | Invalid age, negative number is impossible. | Check original form. If typo (e.g., meant 5), correct with documentation. If truly unknown, code as missing. |
| 003 | 31 | Male | 4 | Logic error, males do not attend ANC. | Check original form. Likely a coding error (sex should be Female). Correct with documentation. If the respondent was indeed male, investigate why ANC was recorded. |
| 004 | 18 | Female | 12 | Unlikely value, 12 ANC visits is extremely high (WHO recommends 8+). | Check original form. Could be a typo (meant 2?). Verify with the respondent or facility register. Do not assume, confirm. |
Confirm the source, correct only when evidence exists, and document the correction. Never guess. Never delete data without a reason. Your cleaning log is your proof that you did not fabricate or manipulate data.
Use this checklist at the end of every data collection day:
- ☐ Are all required questions answered? (No blank mandatory fields.)
- ☐ Are dates, facility names, and village names correctly recorded? (No "N/A" or vague entries.)
- ☐ Are skip patterns followed correctly? (If "No" to question 5, question 6 should be blank.)
- ☐ Are values within expected ranges? (Age 0-120, blood pressure within physiological limits.)
- ☐ Were any refusals, incomplete interviews, or unusual events documented? (Transparency about problems is a sign of good data quality.)
- ☐ Are signatures and IDs present? (Data collector and supervisor must sign.)
- ☐ Is the form legible and complete? (No torn pages, no pencil, use pen only.)
Now you apply everything you have learned. Designing a good tool is a skill that improves with practice. Follow the four-step framework below.
🩺 Community Problem: Many children under five are coming late for treatment of fever. The health team needs to understand why.
Task: Design a simple tool to collect information from caregivers. Your tool should help explain delays and guide community health action.
Before writing a single question, ask: "What do we need to know to solve this problem?" Organise your information needs by category:
| Information Category | What to Know | Why It Matters |
|---|---|---|
| Who is the child? | Age, sex, village, household size. | Identifies vulnerable groups (e.g., infants under 1 year may delay more). |
| What happened? | Fever onset, danger signs recognised, treatment sought. | Reveals whether caregivers recognise danger signs and act appropriately. |
| When did care begin? | Time from fever onset to first action (hours/days). | Quantifies the delay. Allows comparison across groups. |
| Where was care sought? | Home, drug shop, clinic, traditional healer, or health facility. | Reveals care-seeking patterns. Many caregivers go to drug shops first. |
| Why the delay? | Cost, distance, transport, knowledge, decision-making barriers, drug stock-outs. | Identifies the modifiable barriers that the health program can address. |
Each question must be clear, specific, and answerable. Avoid leading questions, double-barrelled questions, and jargon.
Example Core Questions:
- "When did the fever start?" (Date and time. This allows calculation of delay duration.)
- "What was the first action taken by the caregiver when the child got fever?" (Home care / VHT / drug shop / clinic / health facility / nothing / other. This reveals the care-seeking pathway.)
- "How long did it take from when the fever started until you reached the first provider?" (Hours / days. This quantifies delay.)
- "What was the main reason for not seeking care earlier?" (Cost / distance / no transport / did not know it was serious / husband not home to decide / no drugs at facility / other. This identifies barriers.)
- "Was the child tested or treated for malaria?" (Yes / No / Don't know. This checks whether appropriate care was received.)
⚠️ Weak vs. Strong Questions:
- ❌ Weak: "You always take your child early for treatment, don't you?" (Leading, suggests the "correct" answer. Embarrasses respondents who did not.)
- ✅ Strong: "How long after the fever started did you first seek care for your child?" (Neutral, specific, non-judgmental.)
- ❌ Weak: "Did you go to the clinic because of the fever and what medicine did they give?" (Double-barrelled, asks two things at once. Which do you code?)
- ✅ Strong: "Where did you first seek care for the fever?" (One question, one answer.)
| Source / Method | What It Provides | When to Use It |
|---|---|---|
| Primary: Caregiver questionnaire | Direct information about recent fever episodes, delays, and barriers. | When you need to understand behaviour, perceptions, and reasons for delay. |
| Secondary: OPD register | Attendance patterns, diagnosis, age, and date of visit. | When you need to quantify the problem (how many, when, who) and compare with caregiver reports. |
| Qualitative: VHT interviews | Community-level insights on referral barriers, cultural beliefs, and trust in the health system. | When numbers alone do not explain "why" you need stories and context. |
| Sampling: Facility-based | Select caregivers of under-five children attending the facility during the week. | When you need a manageable sample that is easy to access and representative of care-seekers. |
Build quality into the tool from the start:
- Use clear definitions: "Late care" means care sought after 24 hours from fever onset. Define this in the training manual, not just in your head.
- Pretest the tool with 3-5 caregivers before full use. Watch for confusion about "fever" (some cultures use different words), "first action" (some may list multiple things), and "delay" (some may not think they delayed).
- Train data collectors on neutral probing. If a caregiver says "I don't know," the data collector should not suggest answers. They should say: "Take your time. What do you remember?"
- Use local terms for fever. In some communities, "fever" is called "omusujja" (Luganda) or described as "the body is hot." Use the term the respondent understands.
- Review completed forms daily for missing and inconsistent responses. If a caregiver said "no transport" for delay but also said they walked, flag it for follow-up.
- Correct tool problems early and document changes. If question 4 is misunderstood by 4 out of 5 pretest respondents, rewrite it before day 1 of real data collection.
Module: Community Fever Care-Seeking Among Children Under Five
| Variable Name | Question | Response Options |
|---|---|---|
| child_age_months | How old is the child? (in completed months) | ____ months (0-59) |
| fever_start | When did the fever start? (date and approximate time) | Date: ____/____/____ Time: ____ |
| first_action | What was the first action taken when the child got fever? | 1=Home care 2=VHT 3=Drug shop 4=Health facility 5=Nothing 6=Other |
| time_to_care | How many hours passed from fever start until first action? | ____ hours (0-168) |
| delay_reason | What was the main reason for not seeking care earlier? | 1=Cost 2=Distance 3=No transport 4=Did not know serious 5=Decision-maker absent 6=Facility closed 7=Other |
| malaria_tested | Was the child tested for malaria? | 1=Yes 2=No 3=Don't know |
| malaria_treated | Was the child given malaria treatment? | 1=Yes 2=No 3=Don't know |
When presenting your tool, cover these five points:
- State the health problem and the purpose of your tool. What are you trying to learn, and why does it matter?
- Identify your data source and collection method. Primary (questionnaire), secondary (register), or both? Why did you choose this method?
- Show five core questions and explain why each is included. Link every question to a specific information need.
- Explain two quality-control checks you will use. One during collection (e.g., daily form review) and one after (e.g., logic checks for inconsistencies).
- Mention one ethical issue and how you will address it. Informed consent? Confidentiality? Protection of vulnerable children? Respect for cultural practices?
- Health data come from routine records, surveys, surveillance, and research studies. Each source has strengths and limitations.
- Data quality means the data are accurate, complete, timely, consistent, and valid. Poor quality data are worse than no data, they lead to wrong decisions.
- Data collection methods should match the objective and the source of information. Do not use a questionnaire when a register already has the answer. Do not use a register when you need to understand "why."
- Quality control begins during tool design and continues through training, supervision, and cleaning. It is not a one-time check at the end.
- A simple, clear tool is usually better than a long, confusing one. Ten good questions beat fifty bad ones.
- Ethics are inseparable from data collection. Informed consent, confidentiality, and respect for respondents are not optional, they are professional obligations.
Q: Which data source would you use to count outpatient malaria cases for last month?
Answer: The OPD register (secondary source). It already records diagnosis, date, and patient count. A survey would be unnecessary and wasteful.
Key principle: Use existing data before collecting new data.
Q: Name two dimensions of data quality and give one example of each.
Answer:
• Accuracy: A blood pressure reading of 120/80 is accurate if measured with a calibrated machine and proper technique. A reading of 300/200 is likely inaccurate (check the cuff size and patient position).
• Completeness: An ANC register with 95% of required fields filled is complete. One with 40% missing is incomplete and unreliable for planning.
Other valid dimensions: Timeliness (data available when needed), Consistency (same method over time), Validity (measures what it claims to measure).
Q: When is an interview better than a questionnaire?
Answer: An interview is better when:
• The respondent is illiterate or has low literacy.
• The topic is sensitive (sexual behaviour, domestic violence, substance use) and requires trust and probing.
• The questions are complex and need explanation (e.g., "What do you think causes malaria?").
• You need to explore unexpected answers (qualitative depth).
A questionnaire is better for large samples, standardised responses, and quantitative analysis.
Q: Give one quality-control check during data collection.
Answer: Supervisor observation of interviews. The supervisor watches silently as the data collector conducts an interview, then gives feedback on technique (neutral probing, correct skip patterns, respectful behaviour). Another valid answer: Daily form review before leaving the field to catch missing or inconsistent responses while the respondent is still available.
Q: Rewrite this weak question: "You always take your child early for treatment, don't you?"
Answer: Weak because: It is leading (suggests the "correct" answer), double-barrelled ("always" + "early"), and judgmental (embarrasses respondents who delayed).
✅ Strong rewrite: "How many hours passed from when your child's fever started until you first sought care?" (Specific, neutral, quantitative, non-judgmental.)
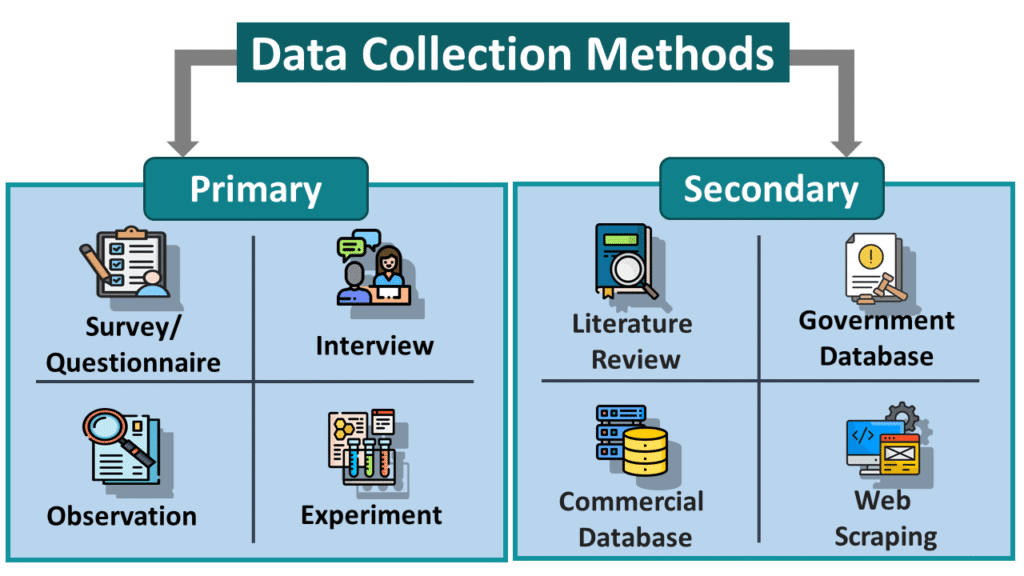
Q: What is the difference between primary and secondary data?
Answer:
• Primary data: Collected specifically for your study. You control the method, timing, and quality. Example: A caregiver questionnaire about fever delays.
• Secondary data: Already exists, collected for another purpose. You do not control how it was collected. Example: OPD registers, HMIS reports, census data.
Primary data are more tailored but more expensive. Secondary data are cheaper but may not answer your exact question.
Q: Why should you keep raw data separate from cleaned data?
Answer: Raw data are your original, unaltered record. If someone questions your findings, you can show the raw data as proof. Cleaned data have been modified, and if you make a mistake during cleaning, you need the raw data to start over. Never overwrite raw data. It is your audit trail and your insurance policy.
Q: What is informed consent, and why does it matter in data collection?
Answer: Informed consent means the respondent understands:
• The purpose of the study.
• What they will be asked to do.
• That participation is voluntary and they can withdraw at any time.
• How their data will be used and protected.
• Any risks or benefits.
It matters because respect for persons is a core ethical principle. Forcing someone to participate or hiding the true purpose is unethical and may invalidate your data.
Q: What is a skip pattern, and why is it important?
Answer: A skip pattern (or filter) directs the data collector to skip irrelevant questions based on a previous answer. Example: If a respondent answers "No" to "Are you pregnant?" the data collector skips all pregnancy-related questions. This prevents illogical responses (a male answering pregnancy questions) and saves time.
In electronic tools (ODK, KoboToolbox), skip patterns are programmed automatically. In paper tools, arrows or instructions must be clear.
Q: What should you do if you find an impossible value during data cleaning?
Answer: Follow the QC golden rule:
1. Do not delete or change it immediately.
2. Check the original form or re-contact the respondent if possible.
3. Correct only when evidence exists (e.g., a clear typo: "-5" should be "5").
4. Document the correction in your cleaning log (record number, variable, old value, new value, reason, date, your name).
5. If the value cannot be verified, code it as missing and note why.
Apply what you have learned to your own context:
- Think of one health problem in your community or clinical area. (Example: Low immunisation coverage, high teenage pregnancy, frequent drug stock-outs.)
- Write one objective that can be answered using data. (Example: "To determine the proportion of children under 1 year who are fully immunised in Village X.")
- Identify one data source and one collection method. (Example: Immunisation register + structured observation of vaccination sessions.)
- Write three clear questions you would include in your tool. Make them specific, neutral, and answerable.
- Explain how you would protect data quality and confidentiality. (Example: Daily supervisor review, secure storage, coded IDs instead of names, informed consent.)
- World Health Organization (WHO). (2020). Framework and Standards for Country Health Information Systems. Geneva: WHO Press.
- Centers for Disease Control and Prevention (CDC). (2012). Principles of Epidemiology in Public Health Practice (3rd ed.). Atlanta, GA.
- Bowling, A. (2014). Research Methods in Health: Investigating Health and Health Services. McGraw-Hill Education.
- Gordis, L. (2013). Epidemiology (5th ed.). Saunders Elsevier.
Quick Quiz
Data Source and Data Collection Quiz
Epidemiology and Biostatistics
Privacy: Your details are used only for quiz tracking and certificates.
Data Source and Data Collection Quiz
Epidemiology and Biostatistics
Preparing questions...
Choose your answer and keep your streak alive.
Great effort.
Here is your quick performance summary.