
By the end of this session, you should be able to:
- Explain the role of biostatistics in health decision making.
- Define data, population, sample, and variable.
- Distinguish dependent and independent variables.
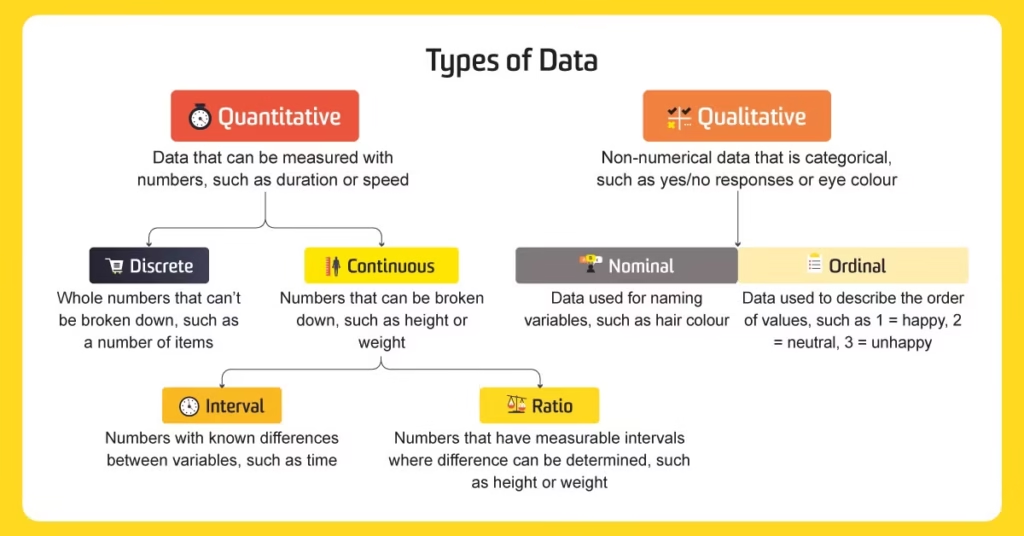
- Classify data as qualitative, quantitative, discrete, or continuous.
- Apply these concepts using nursing and community health examples.
Biostatistics is the use of statistical methods to collect, summarize, analyze, and interpret health related data. It is the bridge between raw numbers and meaningful health decisions.
The Biostatistics Equation
BIO (Life, health, disease, patients) + STATISTICS (Methods for working with data) = BIOSTATISTICS (Statistics applied to health sciences)
Biostatistics is not just for researchers or statisticians. It is an essential tool for every nurse who wants to provide evidence based care and protect their community.
- To understand patient records and ward reports: A nurse who can read and interpret data tables, graphs, and summary statistics can spot problems faster and communicate them clearly.
- To judge whether a treatment or intervention worked: Did the new handwashing protocol reduce infections? Did the nutrition education program improve children's weight? Biostatistics gives you the numbers to answer these questions.
- To detect unusual patterns such as outbreaks: A sudden spike in diarrhoea cases, a cluster of wound infections, or an unexpected drop in immunisation coverage, all of these are statistical signals that require action.
- To communicate evidence clearly to teams and communities: When you tell a village leader that "malaria cases dropped by 40% after net distribution," you are using biostatistics to build trust and motivate action.
- To make safer decisions using facts, not guesswork: Intuition is valuable, but data is verifiable. Biostatistics helps you separate real trends from random noise.
💡 Key Insight: A nurse without biostatistics is like a clinician without a stethoscope, you can function, but you are missing a critical tool for understanding what is really happening.
| Step | What Happens | Nursing Example |
|---|---|---|
| Data | Raw facts or observations are collected. | Blood pressure readings from 200 ANC patients; temperature records from the paediatric ward. |
| Information | Data is organized and summarized into meaningful patterns. | "45 out of 200 ANC patients (22.5%) have hypertension." "Average waiting time is 2.5 hours." |
| Evidence | Information is analyzed to answer specific questions and test hypotheses. | "Women who attended ANC before 12 weeks were 30% less likely to have anaemia at delivery." |
| Decision | Evidence is used to guide action, policy, or clinical practice. | "We will screen all ANC patients for hypertension and start iron folate supplementation in the first trimester." |
🏥 Clinical Example: A clinic reviews ANC records and finds many women have low haemoglobin. The data shows 60% of pregnant women are anaemic. The information is organized by trimester. The evidence shows that women who started iron folate in the first trimester had higher haemoglobin at delivery. The decision: improve iron folate counselling and ensure early initiation.
Data are facts or observations collected for a purpose. In health, data comes from patients, records, surveys, observations, laboratory tests, and community reports.
- A single patient record is one unit of data.
- A collection of records becomes a dataset.
- A dataset organized into rows and columns is the foundation of all biostatistical analysis.
| Patient ID | Age | Sex | Temperature | Diagnosis |
|---|---|---|---|---|
| 001 | 28 years | Female | 38.5°C | Malaria |
- Each column is a variable (a characteristic that can vary).
- Each row is a patient or observation (one unit of data).
📝 Exam Tip: In biostatistics, we organize patient observations so that patterns can be seen and decisions can be made. A messy register is data. A clean table is information. A graph with a trend line is evidence.
| Term | Definition | Nursing Example |
|---|---|---|
| Population | The entire group of people or records that we are interested in studying. It is the complete set. | All first year nursing students at Mulago. All under five children in a parish. All pregnant women attending ANC at Hospital X. |
| Sample | A smaller, manageable subset selected from the population for actual study. We use samples because studying the entire population is usually impossible. | 50 selected students from the nursing school. 120 selected under five children from the parish. 80 pregnant women interviewed from the ANC register. |
⚠️ Key Idea: A sample should represent the population well enough to support fair conclusions. A biased sample (e.g., only interviewing rich families) produces misleading results. A representative sample (randomly selected, matching the population's characteristics) produces trustworthy evidence.
Study Question: What proportion of under five children in a parish had malaria symptoms in the last two weeks?
| Element | Description |
|---|---|
| Target Population | All under five children in the parish. |
| Sampling Frame | Households listed by the Village Health Team (VHT). This is the list from which the sample is drawn. |
| Sample | 120 selected under five children, chosen using systematic random sampling (every 5th household on the VHT list). |
Why this matters: If the VHT list is incomplete (missing poor households or remote villages), the sample will be biased. The findings may underestimate true malaria burden. Good sampling requires a complete, accurate sampling frame.
💡 Mnemonic: Population vs. Sample: "Population = People All Together. Sample = Selected Part." Think of tasting soup: you do not drink the whole pot (population), you take a spoonful (sample) to judge the flavour. But the spoonful must be stirred well (random sampling) to represent the whole pot.
A variable is any characteristic that can take different values across people, places, records, or time. If a characteristic is the same for everyone, it is a constant, not a variable.
| Variable Type | Definition | Examples |
|---|---|---|
| Patient Variable | Characteristics of the individual patient. | Age, sex, weight, blood pressure, temperature, occupation. |
| Disease Variable | Characteristics of the disease or condition. | Diagnosis, severity, duration of illness, complications. |
| Service Variable | Characteristics of the healthcare service or system. | Waiting time, medicine availability, referral status, nurse to patient ratio. |
⚠️ Constant vs. Variable: If you study only female patients, "sex" is a constant (all are female), it does not vary, so it cannot explain differences in outcomes. A variable must vary. This is why researchers sometimes exclude constants from analysis or stratify by them.
- Patient age: 5 months, 20 years, 72 years. (Quantitative, discrete)
- Outcome of delivery: Live birth, stillbirth, maternal referral. (Qualitative, nominal)
- Treatment received: ORS, antibiotic, antimalarial, none. (Qualitative, nominal)
- Pain score: 0 to 10 scale. (Quantitative, ordinal, or sometimes treated as discrete)
- Length of hospital stay: Number of days admitted. (Quantitative, discrete)
- Blood pressure: 120/80 mmHg. (Quantitative, continuous)
- Patient satisfaction: Poor, fair, good, excellent. (Qualitative, ordinal)
In research and epidemiology, variables are classified by their role in the study, not just by what they measure.
| Term | Definition | Also Called |
|---|---|---|
| Independent Variable | The possible cause, exposure, predictor, or factor that may influence an outcome. It is the "input" or "explanation." | Exposure, predictor, explanatory variable, risk factor, intervention. |
| Dependent Variable | The outcome, response, or result being explained or measured. It is the "output" or "effect." | Outcome, response variable, endpoint, result. |
💡 Simple Question to Identify Variables: "What factor may influence what outcome?" The factor is the independent variable. The outcome is the dependent variable.
Research Question: Does sleeping under an insecticide treated net (ITN) reduce malaria among children under five?
| Variable | Role | Values |
|---|---|---|
| Net use | Independent variable (exposure) | Yes / No |
| Malaria status | Dependent variable (outcome) | Positive / Negative |
Interpretation: Net use is the exposure (the thing we think might cause or prevent something). Malaria status is the health outcome (the thing we are trying to explain or predict).
Research Question: Is early ANC attendance associated with maternal anaemia at delivery?
| Variable | Role | Values |
|---|---|---|
| Early ANC attendance | Independent variable (exposure) | Before 12 weeks: Yes / No |
| Anaemia at delivery | Dependent variable (outcome) | Yes / No (or Hb level in g/dL) |
Important: The dependent variable is the outcome you want to explain. Never confuse the two. A common exam trap: students label "early ANC" as the outcome because it "sounds like a good thing." But in this study, we are asking whether early ANC causes less anaemia, so anaemia is the outcome.
Research Question: Does health education improve handwashing practice among mothers?
| Variable | Role | Data Type |
|---|---|---|
| Health education received | Independent variable | Qualitative, nominal (Yes / No) |
| Handwashing practice | Dependent variable | Qualitative, nominal (Good / Poor) or ordinal (Never, Sometimes, Always) |
| Mistake | Why It Is Wrong | How to Fix It |
|---|---|---|
| Calling every variable an "outcome" | Not every variable is something you are trying to explain. Age is a characteristic, not an outcome. | Ask: "What am I trying to explain or predict?" That is the outcome. |
| Choosing the dependent variable before stating the research question | The research question defines the variables, not the other way around. | Always write the research question first. Then identify the exposure and outcome. |
| Using variables that are too vague to measure | "Good health" cannot be measured. "Haemoglobin ≥11 g/dL" can. | Make variables specific, observable, and measurable. |
| Mixing exposure and outcome in the same question | A question like "Does malaria cause net use?" reverses causality. People buy nets because of malaria risk, not the other way around. | Ensure temporal sequence: exposure must come before outcome. |
| Forgetting that one study may have several predictors | Malaria is not caused only by net use. Age, season, housing, and immunity also matter. | Identify the main predictor, but acknowledge confounding variables. |
📝 Exam Tip: When asked to identify independent and dependent variables, always start by writing the research question clearly. Then ask: "What is the exposure/predictor?" (independent) and "What is the outcome?" (dependent). If you cannot write a clear question, you cannot identify the variables correctly.
Classifying data correctly is essential because the type of data determines how you summarize it, analyse it, and present it. Using the wrong statistical method for the wrong data type leads to meaningless or misleading results.
Are the values categories/labels or numbers with mathematical meaning?
Categories → Qualitative. Numbers → Quantitative.
Qualitative data are grouped into categories or labels. Even if numbers are used as codes, they are not quantities, they are just labels.
- Examples: Sex (male, female), blood group (A, B, AB, O), marital status (single, married, divorced), diagnosis (malaria, pneumonia, diarrhoea), ward (male, female, paediatric).
- How to summarize: Counts and percentages. "40% of patients were diagnosed with malaria." "60% were female."
- Statistical tests: Chi square test, Fisher's exact test (for comparing proportions between groups).
| Type | Definition | Examples |
|---|---|---|
| Nominal | Categories without natural order. You cannot say one category is "better" or "higher" than another. | Blood group (A, B, AB, O), sex (male, female), diagnosis (malaria, TB, diabetes), ward (male, female, paediatric). |
| Ordinal | Categories with natural order or rank. You can say one is "more" or "less" than another, but the gaps between categories are not equal. | Pain severity (mild, moderate, severe), triage level (red, yellow, green), satisfaction (poor, fair, good, excellent), disease stage (Stage I, II, III, IV). |
⚠️ Critical Distinction: In ordinal data, the order matters but the distance between categories is unknown. "Severe" pain is worse than "moderate," but we do not know if it is exactly twice as bad. You cannot calculate a meaningful average of ordinal data. You report the median or mode, not the mean.
Quantitative data are expressed as meaningful numbers. These numbers can be added, subtracted, averaged, and compared mathematically.
- Examples: Age (28 years), weight (62 kg), temperature (38.5°C), pulse rate (72 bpm), haemoglobin (11.2 g/dL), blood pressure (120/80 mmHg).
- How to summarize: Mean, median, standard deviation, range. "Average age was 32 years (SD 8.5)." "Median haemoglobin was 10.8 g/dL (range 7.2 to 14.1)."
- Statistical tests: t test, ANOVA, correlation, regression (for comparing means or testing associations).
| Type | Definition | Examples |
|---|---|---|
| Discrete | Counted in whole numbers only. You cannot have a fraction of a count. There are gaps between possible values. | Number of children (0, 1, 2, 3...), number of clinic visits (1, 2, 3...), number of tablets (1, 2, 3...), number of malaria episodes (0, 1, 2...). |
| Continuous | Measured on a scale and can take any value within a range, including fractions and decimals. There are no gaps between possible values. | Weight (62.3 kg), height (165.5 cm), temperature (38.7°C), time (2.5 hours), haemoglobin (11.2 g/dL), blood pressure (122/78 mmHg). |
📝 Exam Tip: A common trap is students think "age" is continuous because it can be 28.5 years. But in many health datasets, age is recorded as whole years (28, 29, 30), making it discrete. However, if age is recorded in months, days, or as a decimal, it is continuous. In practice, age is often treated as continuous for analysis. The key is: "Can this value take any value on a scale, or only whole numbers?"
STEP 1: Are the values categories or numbers?
- CATEGORIES → Qualitative Data
- No natural order? → NOMINAL
- Has natural order? → ORDINAL
- NUMBERS → Quantitative Data
- Counted in whole numbers? → DISCRETE
- Measured on a scale? → CONTINUOUS
💡 Mnemonic for Data Types: "No Order? Nominal. Ordered? Ordinal. Discrete = Digits Counted. Continuous = Can be Cut into fractions."
| Variable | Data Type | Explanation |
|---|---|---|
| Sex | Qualitative: nominal | Categories (male, female) with no natural order. Male is not "higher" or "better" than female. |
| Triage level | Qualitative: ordinal | Categories (red, yellow, green) with a clear order: red = most urgent, green = least urgent. But the difference between red and yellow is not necessarily the same as between yellow and green. |
| Number of ANC visits | Quantitative: discrete | Counted in whole numbers (0, 1, 2, 3...). A patient cannot have 2.5 ANC visits. |
| Birth weight | Quantitative: continuous | Measured on a scale. A baby can weigh 2.85 kg, 3.1 kg, or any value in between. There are no gaps. |
| Haemoglobin level | Quantitative: continuous | Measured in g/dL. Can take any value within a physiological range (e.g., 7.2, 11.5, 14.3). |
| HIV test result | Qualitative: nominal | Categories (positive, negative) with no order. Positive is not "higher" than negative, they are just different states. |
| Waiting time in minutes | Quantitative: continuous | Can be 15 minutes, 15.5 minutes, or 15.75 minutes. Time is measured, not counted. |
| Ward of admission | Qualitative: nominal | Categories (male, female, paediatric, maternity) with no natural order. |
| Patient satisfaction | Qualitative: ordinal | Categories (poor, fair, good, excellent) with a clear order, but unequal gaps between categories. |
| Number of children in household | Quantitative: discrete | Counted in whole numbers. You cannot have 2.3 children. |
Choosing the wrong summary statistic is one of the most common errors in health data analysis. Here is how to match data type to the right summary:
| Data Type | Appropriate Summaries | Graphs | Examples |
|---|---|---|---|
| Qualitative: Nominal | Frequencies, percentages, proportions, mode. | Bar chart, pie chart. | "Diagnosis: 40% malaria, 25% pneumonia, 20% diarrhoea, 15% other." |
| Qualitative: Ordinal | Frequencies, percentages, median, mode. Never mean. | Bar chart (ordered), stacked bar chart. | "Pain: 10% mild, 40% moderate, 50% severe. Median = moderate." |
| Quantitative: Discrete | Counts, mean, median, mode, range, standard deviation. | Histogram, bar chart, box plot. | "ANC visits: average of 4 visits (SD 1.2, range 1 to 8)." |
| Quantitative: Continuous | Mean, median, standard deviation, range, interquartile range (IQR). | Histogram, box plot, line graph, scatter plot. | "Weight: median 62 kg (IQR 55 to 70, range 45 to 88)." |
🚨 Critical Error to Avoid: Never calculate a mean for nominal or ordinal data. What is the "average blood group" of A, B, and O? It is meaningless. What is the "average satisfaction" of poor, fair, and good? Also meaningless. For nominal data, use percentages. For ordinal data, use the median or mode. For continuous data, use the mean (if normally distributed) or median (if skewed).
Here is a small dataset from a paediatric clinic. Your task: identify the variables and classify each by data type.
| ID | Age (years) | Sex | Temp (°C) | RDT Result | Visits |
|---|---|---|---|---|---|
| 1 | 2 | F | 38.7 | Positive | 1 |
| 2 | 4 | M | 37.1 | Negative | 2 |
| 3 | 1 | F | 39.2 | Positive | 1 |
| 4 | 3 | M | 36.8 | Negative | 3 |
| Variable | Meaning | Data Type |
|---|---|---|
| Age | Age in years | Quantitative, discrete (recorded as whole numbers: 1, 2, 3, 4). Could be treated as continuous if measured in months or days. |
| Sex | Male or female | Qualitative, nominal (categories with no order). |
| Temperature | Body temperature in °C | Quantitative, continuous (measured on a scale: 36.8, 37.1, 38.7, 39.2, can take any value within a range). |
| RDT Result | Rapid Diagnostic Test for malaria | Qualitative, nominal (Positive / Negative, two categories with no natural order). |
| Visits | Number of clinic visits | Quantitative, discrete (counted in whole numbers: 1, 2, 3, cannot have 1.5 visits). |
📝 Exam Tip: When classifying variables from a dataset, always look at how the data is recorded, not just what it represents. Age is "years lived" (continuous concept) but recorded as whole numbers (discrete in practice). Temperature is measured with a thermometer and can include decimals (continuous). RDT result is a label, not a number (qualitative).
Coding converts answers or observations into organized numerical values for computer analysis. It is the bridge between the real world and the dataset.
- Computers cannot analyse words like "male" and "female" directly, they need numbers.
- Coding reduces data entry errors (typing "1" is faster and more consistent than typing "male" every time).
- Coding allows statistical software to perform calculations and generate summaries automatically.
- A well designed coding system makes the dataset cleaner and easier to share with other researchers.
| Category | Code | Why This Code? |
|---|---|---|
| Male | 1 | Simple, consistent, easy to enter. |
| Female | 2 | Sequential numbering avoids confusion. |
| Category | Code | Notes |
|---|---|---|
| Malaria | 1 | Most common diagnosis gets code 1 for efficiency. |
| Pneumonia | 2 | Sequential. |
| Diarrhoea | 3 | Sequential. |
| Other | 99 | "99" is a common convention for "other" or "not specified." |
| Missing / Unknown | 88 or 999 | Use a code that is clearly different from real data. Never leave blank, blanks cause errors. |
- Codes must be documented in a codebook. Every code must have a clear definition. Do not assume you will remember what "3" means in six months.
- Never let codes change the meaning of a variable. If "1 = male" in one dataset, do not use "1 = female" in another dataset without clear documentation.
- Use consistent coding across the entire study. All data collectors must use the same codes.
- Good coding reduces data entry and analysis errors. Simple, logical codes are less likely to be entered incorrectly than long text strings.
- Use standard missing value codes. Common conventions: 88, 99, 999, or -9. Choose one and document it. Never use "0" for missing, zero may be a real value (e.g., zero children).
⚠️ Common Coding Disaster: A researcher codes "male = 1, female = 2" but the data entry clerk sometimes types "M" and "F" instead. The statistical software treats "M" and "F" as text, not numbers, and excludes them from analysis. The result: 30% of the sample disappears. Solution: Use data validation rules in your entry software, and always check for unexpected text in numeric fields.
A poorly defined variable leads to poor data, poor analysis, and poor decisions. A well defined variable is specific, observable, and measurable.
| Weak Variable | Why It Is Weak | Improved Variable |
|---|---|---|
| "Health status" | Vague. What does "health" mean? Physical? Mental? Self rated? | "Haemoglobin level in g/dL" or "Self rated health: poor, fair, good, excellent." |
| "Good service" | Subjective. "Good" means different things to different people. | "Waiting time in minutes" or "Patient satisfaction score (1 to 5 scale)." |
| "Sick child" | Too broad. What disease? What symptoms? How severe? | "Child with confirmed malaria RDT positive and axillary temperature ≥37.5°C." |
| "Treatment improved" | "Improved" is subjective. Improved by how much? Who decides? | "Symptoms resolved by day 3 of treatment (Yes/No, confirmed by nurse assessment)." |
| "Temperature" | Incomplete. Where was it measured? What unit? | "Axillary temperature in °C, measured with digital thermometer after 5 minutes rest." |
💡 The SMART Variable Rule: A good variable is Specific, Measurable, Achievable to collect, Relevant to the research question, and Time bound. Just like SMART goals, SMART variables lead to good research.
Task: In pairs, classify each item as qualitative or quantitative, then identify its subtype. For bonus marks, identify which variables could be dependent variables in a nursing research question.
- Ward of admission
- Number of children in household
- Patient satisfaction: poor, fair, good
- Haemoglobin level
- HIV test result: positive or negative
- Waiting time in minutes
| Variable | Data Type | Could It Be a Dependent Variable? |
|---|---|---|
| Ward of admission | Qualitative, nominal | Rarely, usually a descriptive variable, not an outcome. Could be outcome in a study of triage decisions. |
| Number of children | Quantitative, discrete | Could be outcome in a study of family planning knowledge. More often an independent variable (predictor of maternal health). |
| Satisfaction level | Qualitative, ordinal | Yes, very common dependent variable. Example: "Does waiting time affect patient satisfaction?" |
| Haemoglobin level | Quantitative, continuous | Yes, very common dependent variable. Example: "Does iron supplementation improve haemoglobin?" |
| HIV test result | Qualitative, nominal | Yes, common dependent variable. Example: "Does circumcision reduce HIV incidence?" |
| Waiting time | Quantitative, continuous | Yes, common dependent variable. Example: "Does adding a second triage nurse reduce waiting time?" |
📝 Exam Tip: Any variable can be a dependent variable, it depends on the research question. The same variable (e.g., "waiting time") can be an independent variable in one study ("Does waiting time affect satisfaction?") and a dependent variable in another ("Does adding staff reduce waiting time?"). The research question determines the role.
Task: Each group chooses one nursing problem and fills the template below. This exercise connects all the concepts: research question, population, sample, variables, and data types.
| 📋 Mini Study Template | |
|---|---|
| Element | Your Group's Answer |
| Problem | Example: High fever among children |
| Research Question | Is sleeping under a mosquito net associated with reduced malaria among children under five? |
| Population | Children under five attending OPD at Health Centre X |
| Sample | 50 children selected during one clinic week using systematic random sampling |
| Independent Variable | Sleeping under mosquito net (Yes / No), Qualitative, nominal |
| Dependent Variable | Malaria RDT result (Positive / Negative), Qualitative, nominal |
| Confounding Variables | Age, season, distance from breeding sites, household wealth, mother's education |
| How to Summarize Results | Calculate percentage of RDT positive children among net users vs. non users. Compare using chi square test. |
- Problem: High post operative wound infection rate. IV: Hand hygiene compliance (Yes/No). DV: Wound infection (Yes/No).
- Problem: Low immunisation coverage. IV: Mother's education level (None, Primary, Secondary+). DV: Child fully immunised (Yes/No).
- Problem: Long clinic waiting times. IV: Number of nurses on duty. DV: Waiting time in minutes.
Variable: Malaria RDT result among 50 children
| Element | Description |
|---|---|
| Data type | Qualitative, nominal (Positive / Negative) |
| Summary method | Count and percentage |
| Example result | 18/50 positive = 36% |
| Graph | Bar chart or pie chart showing positive vs. negative |
| Interpretation | More than one third of the sampled children tested positive for malaria. This suggests a significant malaria burden in this population and warrants further investigation and intervention. |
📝 Exam Tip: When interpreting a percentage, always mention both the number and the denominator. "36%" is meaningless without "18 out of 50." Also, always add a clinical or public health interpretation, do not just state the number. Explain what it means for patient care or community health.
Cover the answers and test yourself. If you can answer these clearly, you are ready for Day 7's exam!
A population is the entire group of interest (e.g., all first year nursing students). A sample is a smaller subset selected from that population for study (e.g., 50 randomly selected students). We use samples because studying the entire population is usually impossible, expensive, or time consuming.
Mnemonic: Population = People All Together. Sample = Selected Part.
- Patient variable: Blood pressure (continuous), age (discrete), sex (nominal).
- Service variable: Waiting time in minutes (continuous), medicine availability (nominal: available / not available).
- Disease variable: Diagnosis (nominal), severity (ordinal: mild, moderate, severe).
Always classify your examples by data type for extra marks.
Malaria status is the dependent variable (outcome). Net use is the independent variable (exposure/predictor). We are asking whether net use influences malaria status, so malaria is what we are trying to explain.
Remember: The dependent variable is the outcome. The independent variable is the exposure.
Quantitative, continuous. Temperature is measured on a scale (°C or °F) and can take any value within a range (e.g., 36.8°C, 37.1°C, 38.7°C). It has mathematical meaning, you can calculate an average temperature, and that average is meaningful.
If someone classifies temperature as "fever / no fever," it becomes qualitative (nominal). But the raw measurement is quantitative.
Discrete. ANC visits are counted in whole numbers (0, 1, 2, 3, 4...). A woman cannot attend 2.5 ANC visits. There are gaps between possible values.
Discrete = counted. Continuous = measured. This is the key distinction.
Ordinal data has categories with a natural order (e.g., poor, fair, good, excellent), but the distance between categories is not equal or known. "Good" is better than "Fair," but we do not know if it is exactly twice as good. Calculating a mean assumes equal intervals, which ordinal data does not have. For ordinal data, use the median or mode instead.
This is a favourite exam question. Memorise the reason, not just the rule.
A codebook is a document that lists every variable, its definition, the codes used, and what each code means. It is important because:
- It ensures consistency across multiple data collectors.
- It prevents confusion when analysing data months later.
- It allows other researchers to understand and verify your work.
- It reduces data entry errors.
A dataset without a codebook is like a medicine bottle without a label, dangerous and unreliable.
Yes. A variable's role depends entirely on the research question.
- As dependent: "Does iron supplementation improve haemoglobin?" (Haemoglobin = outcome)
- As independent: "Does low haemoglobin increase the risk of post partum haemorrhage?" (Haemoglobin = predictor)
The research question determines the variable's role. There is no "inherent" independent or dependent variable.
- Nominal (e.g., HIV status): Frequencies and percentages. "12% were HIV positive."
- Ordinal (e.g., satisfaction): Frequencies, percentages, median. "Median satisfaction = Good."
- Discrete (e.g., number of visits): Mean, median, range, standard deviation. "Average 4.2 visits (SD 1.3)."
- Continuous (e.g., haemoglobin): Mean or median, standard deviation, range, interquartile range. "Mean Hb 10.8 g/dL (SD 1.4, range 7.2 to 14.1)."
Use median for skewed continuous data (e.g., income, waiting time). Use mean for normally distributed data (e.g., height, weight in large samples).
Precise variable definitions ensure that:
- All data collectors record the same thing the same way (inter rater reliability).
- The data answers the research question (validity).
- The analysis is appropriate for the data type.
- The results are reproducible by other researchers.
- Clinical decisions based on the data are safe and evidence based.
Vague variables = vague data = vague conclusions = dangerous decisions.
- Biostatistics helps nurses turn health data into decisions. It is not just numbers, it is the language of evidence.
- A population is the full group of interest; a sample is the selected part. A good sample represents the population. A bad sample misleads everyone.
- A variable is a characteristic that changes across observations. Constants do not vary and cannot explain differences.
- Independent variables help explain dependent variables. The research question determines which is which.
- Data type determines the correct summary and analysis. Nominal → percentages. Ordinal → median and percentages. Discrete → counts and means. Continuous → mean/median and spread.
- Good coding and clear variable definitions prevent errors. A codebook is not optional, it is essential.
- Never calculate a mean for nominal or ordinal data. It is mathematically meaningless and clinically misleading.
- Grove, S. K., & Cipher, D. J. (2016). Statistics for Nursing Research: A Workbook for Evidence-Based Practice. Elsevier.
- Heavey, E. (2018). Statistics for Nursing: A Practical Approach. Jones & Bartlett Learning.
- Polit, D. F., & Beck, C. T. (2020). Nursing Research: Generating and Assessing Evidence for Nursing Practice. Wolters Kluwer.
Quick Quiz
Principles of Biostatistics Quiz
Epidemiology and Biostatistics
Privacy: Your details are used only for quiz tracking and certificates.
Principles of Biostatistics Quiz
Epidemiology and Biostatistics
Preparing questions...
Choose your answer and keep your streak alive.
Great effort.
Here is your quick performance summary.