
By the end of this session, you should be able to:
- Explain why sampling is used in epidemiology and biostatistics.
- Describe simple random, systematic, stratified, and cluster sampling.
- Identify strengths and limitations of non-probability sampling.
- Calculate simple incidence, prevalence, ratios, and proportions.
- Interpret disease measures for practical nursing decisions.
🧠 Core Question: "If we cannot study everyone, how do we select people fairly?" This is the central challenge of sampling. The answer determines whether your findings are trusted or dismissed.
We sample because studying an entire population is usually impossible, impractical, or unnecessary. Here is why sampling is essential:
- A population may be too large to study completely. You cannot interview all 40 million Ugandans about malaria knowledge. But you can interview 400 carefully selected people and learn a great deal.
- Sampling saves time, money, and staff effort. A census (studying everyone) takes years and costs millions. A well designed survey takes weeks and costs thousands.
- A good sample gives useful information about the wider group. If the sample truly represents the population, the findings apply to everyone not just those interviewed.
- Poor sampling can produce misleading findings. If you only survey clinic attenders, you will overestimate service use. If you only survey urban areas, you will miss rural realities.
⚡ Golden Rule: Good sampling is not about studying many people only; it is about studying the right people. A sample of 80 well chosen mothers is more valuable than a sample of 800 poorly chosen ones.
- TARGET POPULATION: The full group we want to understand
- SOURCE POPULATION: The accessible subset we can reach
- SAMPLING FRAME: The list or method to identify eligible people
- SELECTED SAMPLE: The smaller group actually studied
- COLLECTED DATA: The information we analyse and interpret
| Term | Definition & Example |
|---|---|
| Sampling Unit | The individual person, household, school, or facility that is selected. Example: One mother with a child under one year. |
| Eligibility / Inclusion Criteria | The rule that says who can be included in the study. Example: "Mothers with children aged 0-11 months living in the catchment area for at least 6 months." |
| Representativeness | How well the sample reflects the characteristics of the whole population. A representative sample has the same age, sex, and socioeconomic distribution as the population. |
| Sampling Error | The natural difference between a sample statistic and the true population value. Even a perfect random sample will not exactly match the population but the error is predictable and measurable. Larger samples have smaller sampling error. |
| Sampling Bias | Systematic error caused by poor selection methods. Bias means the sample consistently overrepresents or underrepresents certain groups. Unlike sampling error, bias does not decrease with larger sample size. |
| ❌ Weak Sample (Biased) | ✅ Stronger Sample (Representative) |
|---|---|
| Only easy to reach households (those near the road) | Includes different villages, including remote ones |
| Only clinic attenders (already using services) | Uses household sampling to find non-attenders too |
| Excludes remote villages (no transport to reach them) | Allocates resources to reach remote areas |
| Findings may be biased and not generalisable | Findings are more credible and applicable to the whole population |
A sampling frame is the practical list or source from which sampling units are selected. It is the bridge between the theoretical population and the actual sample.
Examples of sampling frames:
- Village register (list of all households).
- School attendance list.
- ANC (Antenatal Care) register at a health facility.
- Facility list of all health centres in a district.
- Household list from a recent census.
A weak frame is dangerous:
- It may leave out eligible people (e.g., a village register that was last updated 3 years ago misses new households).
- It may include ineligible people (e.g., the ANC register includes women who have since moved away or delivered).
- It may be incomplete (e.g., no register exists for informal settlements).
⚠️ Critical Rule: A sample cannot be better than the frame used to select it. If your frame is missing half the population, your sample will miss them too no matter how fancy your randomisation method is.
🩺 Example: A survey about immunisation interviews only mothers who came to the clinic today.
- Problem: It may miss mothers whose children are most likely to have missed vaccines the very group the survey wants to understand. Mothers who do not come to clinic may be the ones with transport barriers, misinformation, or cultural objections.
- Likely effect: Coverage may appear higher than it truly is in the community. The survey concludes "90% coverage" when the real coverage is 60%.
- Better approach: Sample households or use outreach lists across the entire catchment area. Include mothers who have never attended the clinic.
🩺 The Situation: A health centre serves 1,200 mothers with children under one year. The team wants to interview 120 mothers about missed vaccines. They have village registers from 10 villages.
Task: How should they select mothers fairly?
Step by step thinking:
- Population: 1,200 mothers with children under one year in the catchment area.
- Sampling frame: Village registers from 10 villages. Check: Are the registers complete? Do they include all mothers? Are they up to date?
- Sample size: 120 mothers (10% of the population a reasonable proportion for a survey).
- Selection method:
- Option A Simple Random Sampling: Combine all 10 village registers into one master list of 1,200 mothers. Number them 1 to 1,200. Use a random number table or computer to select 120 numbers. Interview those mothers.
- Option B Systematic Sampling: Sampling interval = 1,200 ÷ 120 = 10. Choose a random start between 1 and 10 (e.g., 7). Then select every 10th mother: 7, 17, 27, 37... up to 1,197.
- Option C Stratified Sampling: If some villages are much larger or poorer than others, divide the 120 sample proportionally by village size. Sample 12 from each village if equal, or proportionally if unequal. This ensures no village is overrepresented or underrepresented.
- Possible bias: Village registers may miss mothers who recently moved in, or mothers who live in informal settlements not on any register. The team should plan for "non response" what if a selected mother is not home? Have a replacement rule (e.g., interview the next household) or revisit later.
Core question: How do we give eligible people a known chance of selection?
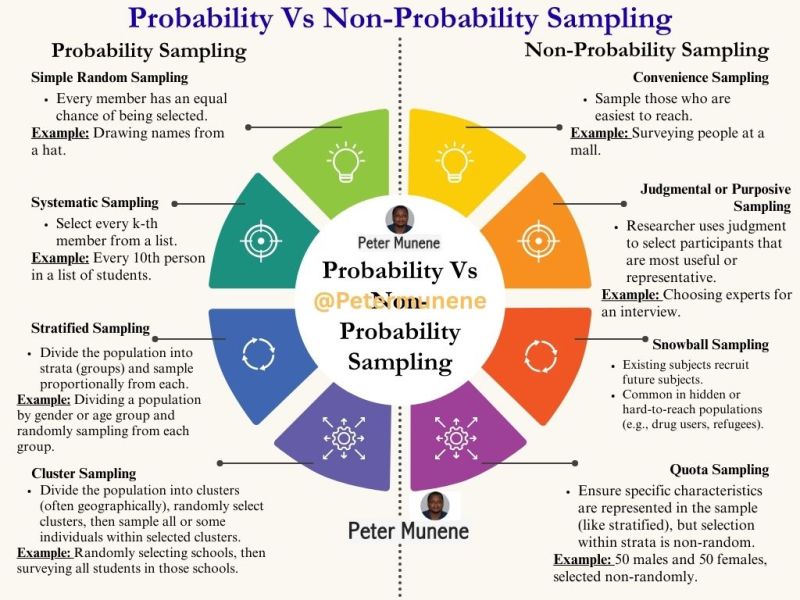
Probability sampling means every eligible unit has a known, non zero chance of being selected. The selection uses a random or rule based method. This is the gold standard for surveys that need to estimate population levels.
How it works:
- Make a complete list of all eligible units in the population.
- Number all eligible units (1 to N).
- Use a random number table, lottery, or computer to select the required sample size.
- Every unit has an equal chance of being selected.
Example: A health centre has a complete ANC register of 500 mothers. The team needs to select 100 for a satisfaction survey. They number the mothers 1-500, use a random number generator to pick 100 numbers, and interview those mothers.
Advantages:
- Simple to understand and explain.
- Every unit has equal chance no subgroup is favoured or ignored.
- Statistical formulas work perfectly (standard errors, confidence intervals).
Limitations:
- Requires a complete list of the population often unavailable in community settings.
- Can be expensive and logistically difficult if selected units are scattered across a wide area.
- May miss small subgroups by chance (e.g., only 2 elderly people selected in a sample of 100).
How it works:
- Calculate the sampling interval (k) = population size ÷ sample size.
- Choose a random starting point between 1 and k.
- Select every kth unit from the ordered list.
Where N = population size, n = sample size, k = sampling interval
Example: 1,000 households ÷ 100 = k = 10. Random start = 3 (chosen between 1 and 10). Selected households: 3, 13, 23, 33, 43... 993.
Advantages:
- Easier to implement than simple random sampling no need for a random number table.
- Spreads the sample evenly across the list.
- Often used in community surveys with household lists.
Limitations:
- Hidden patterns in the list can introduce bias. Example: If a list is ordered by household head (male, female, male, female...) and k = 2, you might select only males or only females.
- If the list has a periodic pattern that matches k, the sample is not random.
- Less flexible than simple random sampling if you need to adjust mid study.
⚠️ Watch Out For: Always check the ordered list for hidden patterns before using systematic sampling. If the list is ordered by age, sex, or village in a repeating pattern, systematic sampling may be biased. In that case, use simple random or stratified sampling instead.
How it works:
- Divide the population into subgroups (strata) based on important characteristics. Strata should be mutually exclusive and collectively exhaustive (everyone fits in one and only one stratum).
- Sample from each stratum separately. You can use simple random or systematic sampling within each stratum.
- Combine the samples from all strata to form the total sample.
Common strata in health surveys:
- Sex (male / female).
- Age group (under 5, 5-14, 15-49, 50+).
- Village or urban/rural.
- School or facility type.
- Socioeconomic status (wealth quintile).
Example: A district has 10 villages. 3 are near the main road (urban like), 7 are remote (rural). If you sample randomly, you might by chance select mostly road side villages. Instead, stratify by location: sample 30 from road side villages and 70 from remote villages, proportional to their population sizes.
Advantages:
- Ensures representation of all important subgroups.
- Allows separate analysis for each stratum (e.g., compare urban vs. rural vaccination rates).
- More precise than simple random sampling when strata are internally similar but different from each other.
Limitations:
- Requires knowledge of the population structure before sampling.
- More complex to plan and analyse.
- If strata are chosen poorly, it adds complexity without benefit.
How it works:
- First stage: Divide the population into natural groups called clusters (villages, schools, zones, parishes).
- Second stage: Randomly select some clusters (not all).
- Third stage: Within selected clusters, sample all individuals or a random subset.
Example: A district has 50 villages. You need to survey 500 households. Instead of listing all households in all 50 villages (impossible), you randomly select 10 villages, then survey 50 households in each selected village.
Advantages:
- Practical and cheap for large, dispersed populations. No need for a complete list of all individuals.
- Reduces travel costs interviewers stay in one area rather than travelling across the entire district.
- Widely used in national surveys (DHS, MICS, SMART surveys).
Limitations:
- People within a cluster tend to be similar (homogeneous). This increases sampling error compared to simple random sampling.
- To compensate, you need a larger sample size than simple random sampling.
- If clusters are selected poorly (e.g., only easy to reach villages), bias is introduced.
| Situation | Best Method | Why |
|---|---|---|
| Complete list of all individuals exists | Simple Random Sampling | Every unit has equal chance; most statistically pure. |
| Ordered list exists; no hidden patterns | Systematic Sampling | Easy to implement; spreads sample evenly. |
| Subgroups differ in risk or access; equity matters | Stratified Sampling | Ensures all subgroups are represented; allows subgroup comparison. |
| Population is large and dispersed; no complete list of individuals | Cluster Sampling | Practical and cost-effective; only need lists of clusters (villages, schools). |
| Equity is important; want to compare urban vs. rural | Stratified + Cluster | First stratify by location, then cluster-sample within each stratum. Common in national surveys. |
Scenario A: 600 ANC clients are listed in a register; select 60.
Answer: Simple Random Sampling or Systematic Sampling. A complete list exists, so either works. Systematic might be easier: k = 600 ÷ 60 = 10. Random start between 1-10, then every 10th client.
Scenario B: A district has 12 villages; fieldwork can visit only 4 villages.
Answer: Cluster Sampling. Villages are the clusters. Randomly select 4 of 12 villages, then survey all or a sample of households within those 4. This is practical because visiting all 12 villages is too expensive.
Scenario C: The study must compare males and females fairly.
Answer: Stratified Sampling. Divide the population into male and female strata. Sample proportionally from each stratum. This guarantees enough males and females for statistical comparison.
Core question: When random selection is not possible, what are the trade offs?
Non probability sampling means selection does not give every eligible person a known chance of being selected. It is faster, cheaper, and useful for hard to reach groups but it carries a higher risk of bias and weaker generalisation.
⚠️ Critical Rule: Use non probability sampling carefully and describe its limitations honestly in any report. Never claim that a convenience sample represents the whole population.
- Meaning: Select those who are easiest to reach.
- When it is used: Pilot studies, practice exercises, rapid assessments, student research with limited time.
- Example: A nursing student interviews patients sitting in the clinic waiting room because they are available right now.
- Limitations:
- May exclude the absent or remote the people who most need to be heard.
- Can overrepresent service users people already in the clinic are not the same as people who never come.
- Weak for population estimates. You cannot say "30% of the district has hypertension" based on a convenience sample of clinic patients.
- Meaning: Select people because they have specific knowledge or experience. The researcher deliberately chooses participants who can provide rich, relevant information.
- When it is used: Qualitative research, key informant interviews, expert consultations, programme evaluations.
- Example: Interviewing TB focal persons about case detection challenges, or interviewing traditional birth attendants about home delivery practices.
- Quality depends on: Clear, transparent selection criteria. The researcher must explain why each person was chosen.
- Meaning: Set required numbers for categories before data collection, then fill each quota with convenient respondents.
- How it works: Decide you need 50 men and 50 women. Interview the first 50 men and 50 women you meet who fit the criteria.
- Example: A rapid assessment in a market decides to interview 20 vendors, 20 shoppers, and 20 passers by.
- Limitation: Quota controls numbers in groups, but it does not remove selection bias by itself. The interviewer still chooses which men and women to interview usually the easiest to approach. It is non random unless selection within quotas is randomised.
- Meaning: Initial participants help identify other eligible participants. Like a snowball rolling downhill it grows as it goes.
- When it is used: Hidden or hard to reach populations: commercial sex workers, drug users, undocumented migrants, men who have sex with men, people with rare diseases.
- Example: A researcher interviews one person living with HIV who then introduces 3 others in their support group, who each introduce more.
- Limitations:
- May overrepresent connected social networks. If the first participant only knows people from one church or one neighbourhood, the sample is biased.
- Weak for estimating true population prevalence. You cannot calculate how common a behaviour is in the whole population from a snowball sample.
- Ethical concerns: participants may feel pressured to recruit others.
| Strengths | Limitations |
|---|---|
| Fast and practical no need for complete lists. | Unknown selection chance you cannot calculate the probability that any person was selected. |
| Useful for pilot studies and pretesting tools. | Higher risk of bias certain groups are systematically overrepresented or excluded. |
| Good for qualitative depth rich, detailed information from key informants. | Weak generalisation findings cannot be confidently applied to the wider population. |
| Can reach special groups that probability sampling cannot (hidden populations). | Requires transparent reporting you must openly state the limitations in any report or publication. |
| Use Probability When... | Use Non Probability When... |
|---|---|
| Estimating prevalence or incidence in a population. | Exploring experiences, beliefs, or perceptions (qualitative research). |
| Comparing population groups (e.g., urban vs. rural). | Finding key informants with specialised knowledge. |
| Informing district or national planning. | Pretesting questionnaires or data collection tools. |
| Generalisation to the wider population is important. | Time, money, or lists are severely limited. |
Study question: Why are some children missing immunisation?
Population: Mothers of children under one year in a catchment area.
Task: Choose one sampling method. State the sampling frame and one likely source of bias. Prepare a two minute explanation.
Example response:
- Method: Stratified random sampling.
- Strata: Urban and rural mothers (because access barriers differ).
- Frame: Village registers for rural areas; facility ANC registers for urban areas.
- Sample size: 100 mothers total 40 urban, 60 rural (proportional to population).
- Likely bias: Village registers may miss mothers who recently moved in or who live in informal settlements not on any register. Urban ANC registers may miss mothers who never attended ANC.
- Mitigation: Use community health workers to identify unregistered mothers. Plan for non response by selecting replacement households.
Core question: After sampling, how do we count and interpret disease occurrence?
A survey is a systematic method of collecting standard information from a defined group of people. It is not just a questionnaire it is a planned method for answering a health question.
What surveys can measure:
- Health status: Prevalence of disease, nutritional status, disability.
- Behaviour: Handwashing practices, net use, sexual behaviour, dietary habits.
- Service use: ANC attendance, vaccination coverage, facility delivery rates.
- Knowledge: Awareness of danger signs, understanding of disease transmission, health literacy.
What makes a good survey:
- Clear questions every question has a purpose and is understood the same way by all respondents.
- Appropriate sampling method matches the study question and population.
- Quality control training interviewers, pretesting tools, supervising data collection, checking for completeness.
- Practical decisions survey results should lead to action, not just sit in a report.
- DEFINE QUESTION
- DEFINE POPULATION
- CHOOSE SAMPLE
- COLLECT DATA
- ANALYSE MEASURES
- USE FINDINGS
⚠️ Critical Rule: Each step should be planned before fieldwork begins. The analysis plan should match the study question. Quality control starts before data collection not after you realise your questionnaire is confusing.
Every disease measure has three essential parts. Without all three, the number is meaningless:
| Component | What It Means |
|---|---|
| Numerator | The number of cases or events counted. Example: 15 new malaria cases. |
| Denominator | The population or group from which the cases came. Example: 120 hostel students. |
| Time Period | The period during which new cases or events occurred. Example: During the month of July 2026. |
Definition: Incidence measures the number of new cases that develop in a population during a specific time period. It tells us about risk the probability that a healthy person will develop the disease.
Incidence = New Cases During a Period ÷ Population at Risk
Usually expressed as a percentage or per 1,000 population
Key rules for incidence:
- The numerator must include new cases only people who did not have the disease at the start of the period.
- The denominator should include people at risk those who could have developed the disease. People who already have the disease should be excluded (unless studying recurrence).
- Incidence must have a time period. Without time, it is not incidence it is just a count.
Incidence Example
Scenario: 15 new malaria cases occurred among 120 hostel students during the month of July.
Incidence = 15 ÷ 120 = 0.125 = 12.5%
Interpretation: About 13 out of every 100 students developed malaria during July. This is the risk of getting malaria in that hostel during that month.
Nursing action: A 12.5% monthly incidence is high. The nurse should investigate: Are nets being used? Is there stagnant water near the hostel? Are students seeking treatment promptly? Consider a mass net distribution or environmental clean up.
Definition: Prevalence measures the total number of existing cases (both new and old) in a population at a specific point in time (point prevalence) or over a period (period prevalence). It tells us about burden how widespread the condition is.
Prevalence = Existing Cases at a Point or Period ÷ Total Population
Includes people who already have the condition + new cases
Key rules for prevalence:
- The numerator includes all existing cases both new and old. A person who has had diabetes for 10 years is still counted in prevalence.
- The denominator is the total population not just those at risk. Everyone in the population could potentially be a case.
- Prevalence is especially useful for chronic conditions (hypertension, diabetes, HIV) and for planning services (how many beds, drugs, or clinics are needed?).
Prevalence Example
Scenario: During a community screening, 18 adults out of 80 screened have high blood pressure.
Prevalence = 18 ÷ 80 = 0.225 = 22.5%
Interpretation: About 23 in every 100 screened adults had high blood pressure readings. This is the burden of hypertension in the screened population.
Nursing action: A 22.5% prevalence suggests hypertension is common in this community. The nurse should: confirm readings with repeat measurements, counsel on lifestyle, refer high readings, plan follow up clinics, and consider community education on diet and exercise.
| Feature | Incidence | Prevalence |
|---|---|---|
| Counts | New cases only | All existing cases (new + old) |
| Measures | Risk how likely is a healthy person to get the disease? | Burden how widespread is the disease right now? |
| Needs time? | Yes must specify the time period | Can be a point in time or a period |
| Denominator | Population at risk (those who could get the disease) | Total population (everyone in the group) |
| Best for | Outbreaks, acute diseases, studying causes | Chronic diseases, planning services, resource allocation |
| Example | "10% of students got malaria in July" | "22.5% of adults screened had high BP" |
Prevalence depends on both incidence and duration of disease:
Prevalence ≈ Incidence × Average Duration of Disease
This means:
- If incidence is high and duration is long → prevalence is very high (e.g., HIV in high burden areas before ART scale up many new infections, and people lived with the disease for years).
- If incidence is high but duration is short → prevalence may be lower than expected (e.g., acute diarrhoea many new cases, but they recover within 3-5 days, so at any single point, few people are sick).
- If incidence drops but duration stays long → prevalence may remain high for years (e.g., diabetes fewer new cases due to prevention, but existing cases live for decades with the condition).
| Mistake | Why It Is Wrong | How to Fix It |
|---|---|---|
| Using total cases when the measure requires new cases only | This gives prevalence, not incidence | Check: Are these new cases or all cases? |
| Forgetting the time period for incidence | Without time, it is not a rate it is just a count | Always state: "per month," "per year," "during the outbreak" |
| Using the wrong denominator | Comparing apples to oranges | Ensure denominator matches the population at risk |
| Reporting a percentage without explaining what it means | Numbers without context are useless | Always interpret: "X out of every 100..." |
| Comparing groups without considering group size | 10 cases in 50 vs. 10 cases in 500 are very different | Always calculate rates, not just counts |
Core question: How do we calculate and interpret basic disease measures accurately?
A ratio compares two quantities where the numerator is not necessarily part of the denominator. The two quantities are independent.
Ratio = One Quantity ÷ Another Quantity
Key feature: The numerator and denominator are separate groups. One is not a subset of the other.
Example: 30 male patients and 60 female patients attended the clinic.
Male to female ratio = 30 : 60 = 1 : 2
Interpretation: There is 1 male patient for every 2 female patients.
Other nursing examples:
- Nurse to patient ratio: 5 nurses for 50 patients = 1 : 10
- Doctor to nurse ratio: 2 doctors for 10 nurses = 1 : 5
- Bed to population ratio: 100 beds for 50,000 people = 1 : 500
A proportion compares a part to the whole, where the numerator is included in the denominator. It is always expressed as a decimal or percentage.
Proportion = Part ÷ Whole
Key feature: The numerator is a subset of the denominator. The result ranges from 0 to 1 (or 0% to 100%).
Example: 20 diarrhoea cases among 200 children screened.
Proportion = 20 ÷ 200 = 0.10 = 10%
Interpretation: 10% of screened children had diarrhoea.
Other nursing examples:
- Proportion of ANC attendees who are HIV positive: 15 HIV+ women ÷ 200 ANC attendees = 7.5%
- Proportion of deliveries by caesarean section: 30 C-sections ÷ 300 deliveries = 10%
- Proportion of children fully immunised: 85 fully immunised ÷ 100 children = 85%
A rate describes how fast events occur in a population over time. It is the most informative measure in epidemiology because it combines count, population, and time.
Rate = Occurrence ÷ Population at Risk over Time
Key features:
- Rates must state the time period.
- Rates allow comparison between groups of different sizes.
- Incidence is the most common type of rate.
- Rates are often expressed "per 1,000" or "per 100,000" for rare diseases.
Example: 40 new malaria cases in a village of 500 children during August.
Rate = 40 ÷ 500 = 0.08 = 8% per month (or 80 per 1,000 per month).
Why "per 1,000" is useful: For rare diseases, percentages are tiny and hard to interpret. Saying "0.002% got Ebola" is confusing. Saying "2 cases per 100,000 population" is clear and standard for international comparison.
Scenario: A village has 500 children under five. During August, 40 new diarrhoea cases are recorded. At the end of August, 25 children still have diarrhoea.
Question: Calculate August incidence and end of month prevalence.
Answer:
| Measure | Formula | Calculation | Result | Interpretation |
|---|---|---|---|---|
| Incidence | New cases ÷ Population at risk | 40 ÷ 500 | 8% | 8 out of every 100 children developed diarrhoea in August |
| Prevalence | Existing cases ÷ Total population | 25 ÷ 500 | 5% | 5 out of every 100 children had diarrhoea at the end of August |
Why the difference?
- Incidence (8%) counts all new cases that occurred during August including those who already recovered by month end.
- Prevalence (5%) counts only those still sick at the end of the month.
- The gap (8% − 5% = 3%) represents children who got diarrhoea but recovered before month end.
| Scenario | Measure | Calculation | Interpretation |
|---|---|---|---|
| Village A: 30 new malaria cases among 300 people in July | Incidence (risk) | 30 ÷ 300 = 10% | High risk — 1 in 10 people got malaria that month. Needs urgent vector control. |
| Village B: 30 new malaria cases among 1,500 people in July | Incidence (risk) | 30 ÷ 1,500 = 2% | Lower risk — 1 in 50 people got malaria. Still monitor, but less urgent. |
| Health centre: 18 high BP readings among 80 adults screened | Prevalence | 18 ÷ 80 = 22.5% | About 1 in 4 screened adults has high BP. Plan NCD follow up clinic. |
| Clinic register: 12 males and 36 females attended ANC education | Ratio | 12:36 = 1:3 | For every male companion, 3 female companions attended. Male involvement is low. |
When you calculate a disease measure, follow these five steps to interpret it meaningfully for public health action:
| Step | What to Do | Example |
|---|---|---|
| 1. Name the measure | Is it incidence, prevalence, ratio, or proportion? | "This is an incidence measure..." |
| 2. State the group | Among whom was it calculated? | "...among hostel students..." |
| 3. State the time | When or over what period? | "...during the month of July..." |
| 4. Translate to plain language | "X out of every 100..." | "...about 13 out of every 100 students..." |
| 5. Suggest one action | What should be done? | "...suggests the need for improved net use and environmental clean up." |
Full example interpretation:
"The incidence of malaria among hostel students was 12.5% during July. This means about 13 out of every 100 students developed malaria that month. This high risk suggests the need for improved insecticide treated net use, removal of stagnant water near the hostel, and prompt testing and treatment of febrile students."
Task: Choose one health problem: malaria, diarrhoea, missed immunisation, or hypertension.
- Define the population and sampling frame.
- Choose a sampling method and justify it.
- Create a small dataset and calculate one disease measure (incidence, prevalence, ratio, or proportion).
- Present findings in three minutes using the 5 step interpretation framework.
Assessment focus: Clear sampling plan, correct calculation, and practical interpretation.
Example response structure:
"We studied [population] using [sampling method] because [justification]. Our sampling frame was [frame]. We found a [measure] of [X%], which means [interpretation]. Therefore, we recommend [action]. One limitation is [bias/limitation]."
| Question | Answer |
|---|---|
| Why is sampling used in epidemiology? | Because populations are often too large, expensive, or time consuming to study completely. A good sample gives valid information about the wider group without the cost of a census. |
| What is the difference between stratified and quota sampling? | Stratified sampling uses random selection within each stratum (probability method valid for generalisation). Quota sampling sets numbers for categories but uses convenience selection within quotas (non probability method faster but biased). |
| When would cluster sampling be practical? | When the population is large and dispersed, no complete list of individuals exists, and travel costs must be minimised (e.g., national immunisation coverage surveys, DHS, MICS). |
| How is incidence different from prevalence? | Incidence counts new cases over a time period (measures risk "how many got sick?"). Prevalence counts all existing cases at a point or period (measures burden "how many are sick?"). |
| Why must every rate have a denominator and time period? | Without a denominator, you cannot compare groups of different sizes. Without a time period, you cannot distinguish rapid outbreaks from slow trends. A rate without both is just a number not actionable evidence. |
| What is the formula for systematic sampling? | k = N ÷ n (population size ÷ sample size = sampling interval). Choose random start between 1 and k, then select every kth unit. |
| What is sampling bias, and how is it different from sampling error? | Sampling bias is systematic error caused by poor selection methods it does not decrease with larger sample size. Sampling error is random natural variation between sample and population it decreases with larger sample size. |
| Why is a sampling frame important? | A sample cannot be better than the frame used to select it. If the frame is incomplete, outdated, or excludes certain groups, the sample will be biased no matter how random the selection method is. |
| When should you use non probability sampling? | For exploratory research, qualitative depth, pilot studies, pretesting tools, or when studying hard to reach/hidden populations where probability sampling is impossible. |
| How do you interpret a ratio of 1:3 male to female? | For every 1 male, there are 3 females. This does NOT mean 25% are male (that would be a proportion). It only compares the two groups. |
- Gordis, L. (2014). Epidemiology. Elsevier Saunders.
- Bonita, R., Beaglehole, R., & Kjellström, T. (2006). Basic Epidemiology. World Health Organization.
- Webb, P., Bain, C., & Page, A. (2017). Essential Epidemiology: An Introduction for Students and Health Professionals. Cambridge University Press.
Quick Quiz
Sampling Methods Quiz
Epidemiology and Biostatistics
Privacy: Your details are used only for quiz tracking and certificates.
Sampling Methods Quiz
Epidemiology and Biostatistics
Preparing questions...
Choose your answer and keep your streak alive.
Great effort.
Here is your quick performance summary.